Bitcoin Price Forecast This Week: BTC $63,892 and Stuck Under $65K for the Fourth Time
Bitcoin closed July at $63,892, down 1.13%, after failing again at the $65,000 to $66,075 resistance band. Month-end ETF outflows, a big options expiry, and the levels that matter.
TL;DR
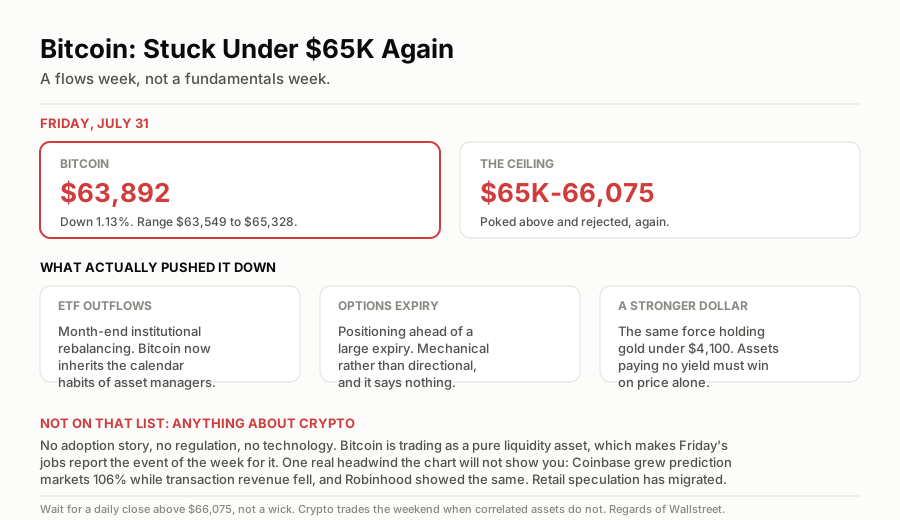
- Bitcoin traded at $63,892.66 on Friday, down 1.13% over 24 hours, with an intraday range of $63,549.28 to $65,328.18.
- That high is the story: BTC poked above $65,000 and could not hold it, again. The resistance band is $65,000 to $66,075.
- Three things weighed on it at once: month-end ETF outflows, positioning into a large options expiry, and a stronger dollar.
- It is barely changed from the $65,000 we flagged a week ago, when bitcoin was coming off the worst ETF month on record and a 21-month low.
- Bitcoin is trading as a liquidity asset, not a haven. That makes Friday's jobs report the event of the week for it, exactly as it is for gold.
Where Bitcoin Is
| Reading | Level |
|---|---|
| Friday | $63,892.66, down 1.13% |
| Intraday high | $65,328.18 |
| Intraday low | $63,549.28 |
| Resistance band | $65,000 to $66,075 |
| A week ago | around $65,000 |
Two weeks of chop inside a narrow range, with every attempt at $65,000 sold. Bitcoin has now failed at that band repeatedly, and each failure makes the level more visible to more traders, which tends to be self-reinforcing until something breaks it.
The Board
Four attempts at $65,000, four rejections. The band is the whole chart right now.
Why It Fell on Friday
Three forces, and none of them is about bitcoin.
Month-end ETF outflows. Institutional holders rebalance into the end of a month, and spot bitcoin ETFs saw money leave. ETF flows have become the marginal buyer and seller of bitcoin, which means the asset now inherits the calendar habits of traditional asset managers. That is what maturity costs.
A large options expiry. Traders adjust positions ahead of a big expiry, and that adjustment is mechanical rather than directional. It creates selling pressure that means nothing about the next month.
A stronger dollar. The same force holding gold under $4,100. When the dollar is bid and real yields are positive, every asset that pays no yield has to justify itself on price alone.
Notice what is absent from that list: anything about adoption, regulation, or the technology. This was a flows week, not a fundamentals week.
The Levels That Matter
- $65,000 to $66,075 is the ceiling. A daily close above $66,075 would be the first genuine break of the pattern, and it would likely bring momentum buyers back quickly, because a lot of people are watching the same band.
- $63,549 was Friday's low and is the near-term floor. Losing it puts the recent lows back in play.
- The 21-month low set in July is the line that defines the trend. As long as bitcoin holds above it, this is a base. Below it, the July capitulation was not the end of the move.
Friday's Jobs Report Decides It
Bitcoin's correlation to risk assets and to liquidity conditions is now high enough that the macro calendar matters more than the crypto calendar.
The July jobs report at 8:30am ET on Friday August 7 is the week's event. A weak number raises rate-cut expectations, weakens the dollar and loosens the liquidity conditions bitcoin thrives in. A hot number does the reverse, and it also validates the three Fed members who voted to hike in July.
There is a useful cross-read available too. Coinbase reported prediction-markets revenue up 106% quarter over quarter while its transaction revenue fell, and Robinhood showed the same pattern. Retail speculative appetite has not disappeared, it has migrated out of spot crypto and into event contracts. That is a real headwind for bitcoin volumes that no price chart will show you, and we set it out in the Coinbase breakdown.
The Playbook
- The range is the trade until it is not. Bitcoin has spent two weeks between roughly $63,500 and $65,300. Buying the middle of a range is the worst entry available.
- Wait for the close, not the wick. BTC has poked above $65,000 several times. An intraday spike is not a breakout, and treating it as one has been the most expensive mistake in this tape.
- Size for a weekend gap. Crypto trades through Saturday and Sunday when the assets it now correlates with do not. Positions taken on Friday carry two days of unhedgeable risk.
- If you are accumulating long term, a range is a gift. Regular purchases into chop beat trying to time a band that has rejected four times, and the case for that approach is in dollar-cost averaging versus lump sum.
The One-Line Read
Bitcoin sits at $63,892 after another failed attempt at the $65,000 to $66,075 band, pressured by month-end ETF outflows, an options expiry and a firmer dollar rather than by anything specific to crypto: it is trading as a pure liquidity asset now, which means Friday's payrolls print will do more for it than any crypto headline this week, and until there is a daily close above $66,075 the range is the only thing on this chart worth trading.
More on Commodities & Crypto
$USO · 2026-08-01
Oil Price Forecast This Week: Brent $87.84 and WTI Near $85, Grinding Back Up From the Iran Pause
$CVX · 2026-07-31
Chevron's Profit Nearly Quadrupled to $12 Billion. The Stock Rose 1%. That Gap Is the Whole Trade
$SLV · 2026-07-26
Silver Price Forecast This Week: Down 52% From the Record, Is Silver Finally Cheap?
The Sunday Setup
Enjoyed this breakdown? Don’t miss the next market setup.
Get deep-dive analyses delivered to your inbox every Sunday. Free, and built for retail investors.
Comments
0 totalNo comments yet. Be the first to drop a take.