When Does ACM Research Report Earnings? August 7, and Revenue Is Up 25% While Earnings Are Guided Down
ACM Research reports Q2 2026 pre-market on Friday August 7, call at 8:00am ET. Consensus is about $268m of revenue, up 24.5%, with EPS estimates split. Why the margin line decides everything.
TL;DR
- ACM Research reports Q2 2026 before the US market opens on Friday, August 7, with the call at 8:00am ET, which is 8:00pm China time.
- Consensus: revenue of about $268.2 million, up 24.5%. Earnings estimates do not agree, running from $0.30 to $0.36, and the lower figure implies a 44% decline against 25% revenue growth.
- That contradiction is the entire print. A company growing revenue a quarter while earnings fall by nearly half is either investing heavily or losing pricing power, and those look identical until management explains them.
- Q1 set the bar: revenue $231.3 million, up 34.2%, shipments $240.7 million, up 53.6%, gross margin 46.4%, above the midpoint of the long-term 42% to 48% range, and about $1.25 billion of cash.
- The stock was around $79.97 in late July after gaining roughly 150% since March 31. The consensus target is $127.50, and Morgan Stanley raised its target to $130 from $90.
When Does ACM Research Report Earnings?
The short answer: before the US market opens on Friday, August 7, 2026, with the conference call at 8:00am ET.
The 8:00pm China time slot is not decoration. ACM Research is a US-listed company whose operating business, ACM Shanghai, is Chinese, and the call is scheduled so that both shareholder bases can attend. That structure is central to the investment case and we come back to it below.
It reports into the same pre-market block as Vistra, PPL, Take-Two and Oklo, with the July jobs report at 8:30am landing halfway through the call.
What the Street Expects
| Line | Q2 2026 | Comparison |
|---|---|---|
| Revenue | ~$268.2M | up 24.5% |
| EPS, low estimate | ~$0.30 | down about 44% |
| EPS, high estimate | ~$0.36 | |
| Q1 2026 revenue | $231.3M | up 34.2% |
| Q1 2026 shipments | $240.7M | up 53.6% |
| Q1 2026 gross margin | 46.4% | long-term range 42% to 48% |
| Cash and short-term deposits | ~$1.25B | at March 31, 2026 |
| Consensus target | $127.50 | Morgan Stanley $130, raised from $90 |
| Implied volatility, Aug 7 expiry | about 140% | call volume ran 242% above average |
The Board
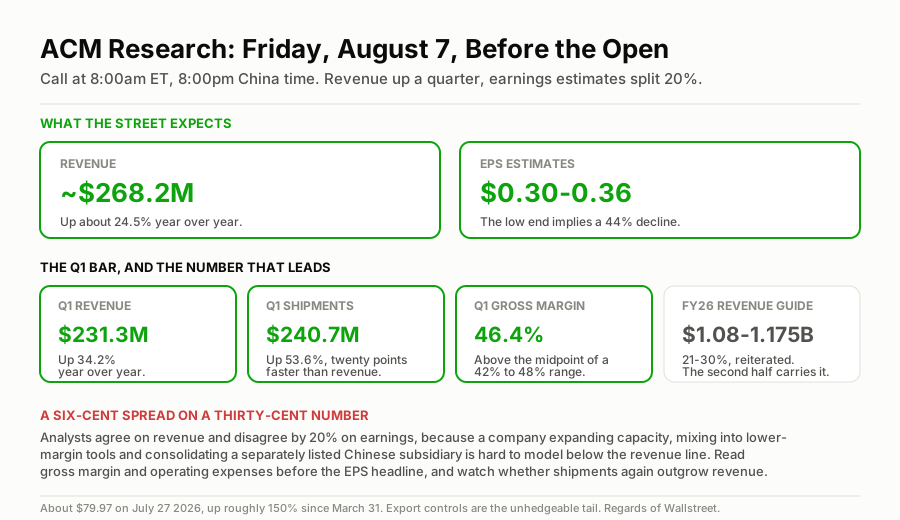
Revenue up a quarter, earnings estimates split, and a six-cent spread on a thirty-cent number.
A Six-Cent Spread on a Thirty-Cent Number
Start with the disagreement, because it is unusually large and unusually informative.
Estimates for the quarter run from $0.30 to $0.36. On a number this small, that is a 20% spread between analysts covering the same company with the same public guidance. Compare that to Vertex, where the whole analyst community sits inside eleven cents on a five dollar quarter.
A spread that wide means the modelling assumptions differ, not the revenue forecast. Revenue is agreed at roughly $268 million. What is not agreed is what falls to the bottom line, and there are three plausible reasons:
One: operating expenses. ACM Research is expanding capacity in multiple geographies simultaneously. Building out production and engineering ahead of revenue is exactly how a 25% revenue increase becomes a smaller profit, and it is the benign explanation.
Two: gross margin mix. Q1 came in at 46.4%, above the midpoint of the company's stated long-term 42% to 48% band, and commentary at the time flagged margin pressure emerging. Semiconductor equipment margins move with product mix, and newer tool categories carry lower margins until volumes build.
Three: the minority interest. This is the one most models get wrong. ACM Research owns a majority of ACM Shanghai, which is separately listed in China. A meaningful share of the operating profit belongs to the minority holders, and the amount attributable to ACM Research shareholders depends on where in the group the profit is earned. That is a modelling problem, not a business problem, and it explains a good deal of a 20% estimate spread.
The practical guidance: read the gross margin line and the operating expense line before the EPS line. The headline number on Friday morning may miss or beat by a wide margin for reasons that say nothing about the business.
The Number That Actually Leads
Shipments grew 53.6% in Q1 while revenue grew 34.2%.
For a capital equipment maker, that gap is the most bullish statistic in the release. Shipments are tools that have left the factory. Revenue is recognised later, when installation and acceptance criteria are met. Shipments growing twenty points faster than revenue means the recognised number is being fed by a bigger pipeline, and the gap closes in future quarters.
If Friday's release shows shipments growing faster than revenue again, the second half is close to underwritten regardless of what the EPS line does. If shipments decelerate below revenue growth, that is the signal to take seriously, and it will not be in the headline.
The Risk Nobody Can Model
ACM Research is listed in the United States, headquartered in Fremont, California, and derives the overwhelming majority of its business from Chinese semiconductor manufacturers.
That has been an enormous advantage. China's domestic chip build-out has been the single fastest-growing source of equipment demand in the world, driven by names we have written about, including CXMT, the DRAM maker that keeps appearing as a supporting actor in other companies' problems. ACM sells cleaning, plating and furnace tools into exactly that build-out, and it is why the stock has gained roughly 150% since March 31.
It is also an unhedgeable tail risk. Export controls, entity listings and cross-border listing rules are policy decisions made without warning, and a single announcement can permanently impair a business that is operationally excellent. No amount of financial analysis prices that, and any position in this stock has to be sized as though a policy headline is possible in any given month.
Is ACM Research a Buy After a 150% Run?
It is a buy for investors who can hold a China-exposed semiconductor equipment maker through a policy shock, at a size that survives one. For everybody else it is a watch.
At around $79.97 against a consensus target of $127.50, with Morgan Stanley at $130 raised from $90, the sell side sees roughly 60% of upside. The business supports some of that: 34% revenue growth, 54% shipment growth, gross margin above the midpoint of its own range, and $1.25 billion of cash.
The bull case: ACM is taking share in wet processing tools against much larger Western incumbents, its shipment growth is outrunning revenue, it is funded, and the domestic Chinese equipment market is in a multi-year capacity cycle that has barely started.
The bear case: the stock has already risen roughly 150% in four months, the earnings estimates are split by 20%, margin pressure was flagged at the last print, and the entire business sits on one side of the most contested trade relationship in the world. A stock that has run this hard does not need bad news to fall twenty percent, it needs an ambiguous sentence about gross margin.
The Options Angle
- This is a genuine mover. A mid-cap semiconductor equipment maker up 150% in four months, reporting into a payrolls morning with a 20% spread on the consensus EPS, is a recipe for a large reaction in either direction.
- We are not selling premium into it. That reflex was the most expensive habit of the July season, when realised moves beat implied repeatedly, and this is exactly the profile where it fails: high recent realised volatility, genuine analyst disagreement and event risk stacked on macro risk.
- At around $79.97, one contract is roughly $7,997 of notional, which keeps defined-risk structures accessible to a normal account.
- The 8:00am ET call runs into the 8:30am payrolls print, so any commentary about the second half will be competing with a macro number for the market's attention. That is a reason to prefer a structure that survives one bad session rather than one that needs an immediate move.
- No clean implied move was published for this print, but the raw option data is loud: implied volatility on the August 7 expiry has run near 140%, and call volume hit roughly 21,130 contracts against a 6,171 average, an increase of about 242%. That is positioning, not a forecast, and it cuts both ways.
- Live prices for individual strikes could not be sourced, so the plays below are quoted against the late-July price.
Trade log
| # | Stance | Structure | Strikes and expiry | Cost or credit | Spot at writing | Implied move | Breakeven |
|---|---|---|---|---|---|---|---|
| 1 | Long volatility | Long strangle | ~$90 call / ~$70 put, first expiry after Aug 7 | debit not sourced | ~$79.97 (Jul 27, 2026) | not sourced | needs roughly ±12% or more |
| 2 | Pass | Short premium into the print | any | credit not sourced | ~$79.97 | not sourced | 150% run, split estimates, payrolls the same hour |
| 3 | Pass | Chasing the shares before the print | n/a | n/a | ~$79.97 | n/a | scored against the Aug 7 close |
Rows 2 and 3 are logged as passes so they get scored. We are saying do not sell volatility and do not chase, and both lose if ACM Research rises quietly on Friday.
The One-Line Read
ACM Research reports before the US open on Friday August 7 with the call at 8:00am ET against consensus revenue of about $268.2 million, up 24.5%, and an EPS consensus that analysts cannot agree on within 20%: the spread exists because a company expanding capacity, mixing into lower-margin tools and consolidating a separately listed Chinese subsidiary is genuinely hard to model below the revenue line, so the numbers to read first are gross margin against the 42% to 48% range and whether shipments once again grow faster than revenue, and the risk nobody can model at all is a policy headline out of Washington or Beijing.
More on AI & Semiconductors
$OKLO · 2026-08-02
When Does Oklo Report Earnings? August 7, and a $6.76 Billion Company Is Expected to Book $3.8 Million of Revenue
$VST · 2026-08-02
When Does Vistra Report Earnings? August 7, With the Stock Near Its 52-Week Low and Profits Up 140%
$DDOG · 2026-08-02
When Does Datadog Report Earnings? August 6, and It Is Guiding Flat Profits on 30% Revenue Growth
The Sunday Setup
Enjoyed this breakdown? Don’t miss the next market setup.
Get deep-dive analyses delivered to your inbox every Sunday. Free, and built for retail investors.
Comments
0 totalNo comments yet. Be the first to drop a take.