Gold Broke $4,000 and Silver Got Cut in Half. Here's Where the Metals Go Next.
Gold fell below $4,000 with its worst week in six months and silver is down 52% from its $121.62 record. Why precious metals are falling during a war, and the gold price forecast for the rest of 2026.
TL;DR
- Gold closed the week below $4,000/oz for the first time since the run began, on track for its worst weekly loss in six months (more than 3%).
- Silver is the bigger wreck: from a $121.62 January record to the mid-$50s, a 52% collapse that nobody frames as a dip anymore.
- The trigger is upside down from the textbook: Middle East escalation pushed oil up, the market read it as an inflation event, and inflation now means Fed hikes, which is gold's kryptonite.
- The Fed math: May PCE printed 4.1%, the first 4-handle in three years, and markets price roughly 60% odds of a hike by September.
- The twist for the forecast: even the banks that just slashed their targets still see year-end gold at $4,500 to $4,900, which is well above spot. The street is bearish for the summer and bullish for December, and that gap is the whole trade.
More on $GLD: Gold Is Down 26% From Its Record and the Reason Isn't Peace →
The Board
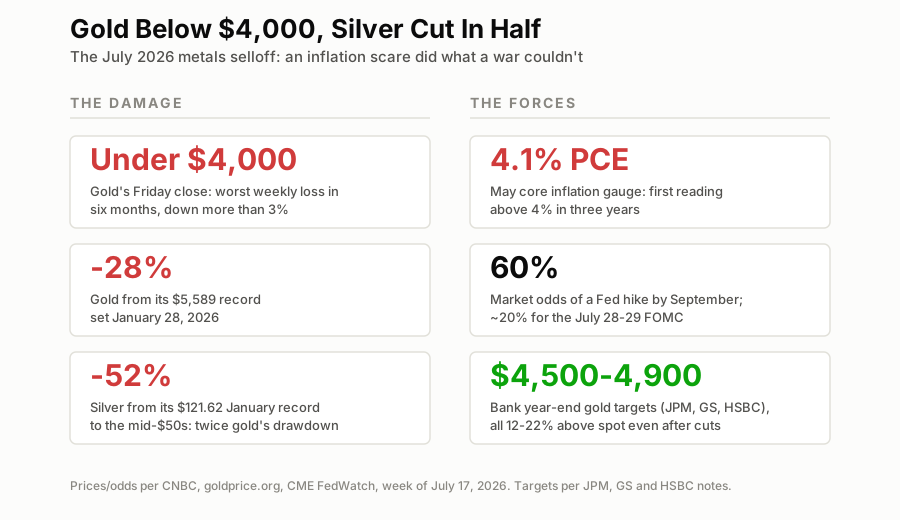
The damage on the left, the forces driving it on the right. Note the last tile: the same desks selling gold today expect it higher by New Year's.
The Week the Floor Gave Out
A week ago we wrote that $4,000 was the round number everyone was watching. It took five sessions to fail. Gold spent Friday pinned under $4,000 and finished with its biggest weekly drop since January, down more than 3%. From the $5,589 record set on January 28, the metal has now surrendered roughly 28%.
Silver didn't get a floor to break because it lost its floor months ago. The January mania that carried it to $121.62 has fully unwound, and at mid-$50s spot the metal is down about 52% from the top, twice gold's drawdown. That's silver doing what silver always does: it's gold with leverage and an industrial day job, so it rises harder, crashes harder, and bottoms uglier.
A War Is Raging and Gold Is Falling. Again.
Missiles are flying, tankers are burning in the Strait of Hormuz, and the safe-haven asset is having its worst week in six months. This is the second time in 2026 the metals have flunked the geopolitics test, and the reason got clearer this week.
The market is not trading this conflict as a flight-to-safety event. It's trading it as an inflation event. Escalation pushes oil up, oil pushes inflation expectations up, and hot inflation drags the Fed toward higher rates. Higher rates mean higher real yields, and rising real yields are the one force gold has never beaten in the modern era. The war premium that built January's record has been fully replaced by a rate premium that works in the opposite direction. Same headlines, inverted trade.
The Fed Math That Decides Everything
Strip away the war and the metals story is three numbers:
- May PCE: 4.1% year over year. First reading above 4% in three years, and it landed on a Fed that was already split 9 to 8 on hiking.
- Hike odds: about 20% for the July 28-29 FOMC, about 60% by September. The market has stopped asking whether cuts are coming and started handicapping which meeting delivers the hike.
- T-bills pay 3.7% risk-free. Gold pays nothing. Every day that gap persists, the opportunity cost of the shiny rock compounds, which is why every war-headline rally keeps getting sold within days.
The July 28-29 meeting is now the single biggest date on the metals calendar. It either validates the hike pricing and opens the trapdoor, or kills it and hands gold its first real bid since winter.
So Where Does Gold Actually Go?
Here's the forecast landscape, both directions:
The near-term path points lower. The July forecast band we flagged last week still runs down to the $3,542 to $3,887 zone, and with $4,000 broken, that band is now the open field below. OCBC expects declines through year-end on the classic bear cocktail: rising Treasury yields, stronger dollar, fading investor demand. Momentum, positioning, and the macro driver all point the same way into the FOMC.
But look at what the banks actually did. JPMorgan slashed its year-end target from around $6,000 to $4,500. Goldman cut from $5,400 to $4,900. HSBC trimmed its average but held its year-end number at $4,750, with a working range of $3,800 to $4,700. Every one of those cuts made headlines as bearish, and every one of those targets sits 12% to 22% above spot. The street's own math says the summer selloff overshoots and the metal finishes the year higher than it trades today.
The sequencing is the forecast. Lower first, into and possibly through the September hike, with the $3,500s in play if the Fed delivers. Then the setup flips: a Fed that has hiked into a slowing consumer is a Fed one bad quarter away from the pivot, and gold's first move off a pivot is historically violent because positioning is maximally offside. That was a 2027 trade when we made the case last week. The banks' year-end targets suggest the market may not even wait that long.
The Options Angle
- Keep selling the war pops. GLD call spreads 30 to 45 days out on every geopolitical spike remain the trend trade: the spike fades, the rate math resumes, the premium is yours. (New to spreads? Start with the calls and puts primer.)
- Puts into the FOMC, not after it. If you want the downside directly, own GLD puts through the July 28-29 meeting while the street's own bands sit near $3,542 to $3,887. Buying them after a hike confirms is paying for yesterday's move.
- Silver is the wrong short now. Down 52%, the high-beta leg of the crash is behind it. Shorting silver here is picking up the last nickels of a move that already happened, with a violent squeeze as the tail risk.
- Bookmark the pivot trade, size it later. The $4,500-4,900 year-end targets are the street pricing a Q4 recovery. The trigger to act is the Fed blinking, not a calendar date.
The One-Line Read
Gold lost $4,000 and silver lost half its value because a war became an inflation problem and inflation became a Fed problem, and the near-term path stays heavy into the September hike. But the same banks cutting their forecasts still see gold 12-22% higher by year-end, so the trade is patience: let the hike land, let the $3,500s print if they're going to, and be early to the pivot instead of early to the bottom.
Next up:PPI, tomorrow at 8:30am ET →
More on $GLD
Updated Every Saturday
The Week Ahead
Every earnings date, Fed event and setup for the current trading week, on one page.
Refreshed Weekly
Earnings Calendar
Who reports next, when, and what consensus and the whisper expect.
The Week-Ahead Brief
Don’t miss next week’s setups. Get the Sunday brief.
Latest issue, Sep 7“Week ahead in the stock market...”
Every Sunday: next week’s earnings dates, Fed days and the trades worth watching, from the same desk that writes the week-ahead hub. Free, built for retail investors.