Why Is Oil Up? Energy's Best Week, and My $80 Call Broke
Iran fired ballistic missiles at a US carrier and destroyer for the first time and both evaded, the US destroyed three more Iranian tankers, and WTI traded near $92.71, up 1.35% intraday.
Iran targeted a US aircraft carrier and a guided-missile destroyer directly. CENTCOM says the Revolutionary Guard's Aerospace Force fired several ballistic missiles at the two ships on September 5. Both evaded the missiles and no personnel were hurt, per Al Jazeera and Army Recognition, both citing CENTCOM. Neither outlet names the ships or gives a missile count. Every earlier round this hub has tracked, from August 31 through September 2, hit tankers or land bases. This is the first strike in the thread aimed straight at a US Navy warship.
The US answered by destroying three more Iranian tankers. It did not strike Iran's military directly. A US admiral, Brad Cooper, is quoted by Al Jazeera saying: "If you shoot at two of our ships, we will impose an even higher economic cost, taking out three of yours." CENTCOM hit one tanker off Kharg Island, one near Jask, and a third, unladen vessel in the Gulf of Oman after ordering its crew to abandon ship. All three are reported destroyed or disabled. Neither side reports casualties from the tanker strikes.
Benchmark Sept 1 read Today, Sept 7 (as of writing) WTI $90.22 settle $92.71, up 1.35% intraday Brent roughly $95 $97.65, up 1.42% intraday
Both figures are from TradingEconomics, captured as of this writing, and will keep moving through the session. A separate live quote from Investing.com had Brent closer to $95.85 minutes earlier. That gap is the normal spread between two real-time feeds during an active session and isn't a reason to doubt either one.
The target changed. The response didn't. Every prior update in this thread asked whether a strike actually landed. This one clearly didn't: CENTCOM says both US ships evaded cleanly. But firing at a carrier is a different signal than firing at a base or a tanker, hit or missed. The US kept its answer inside the pattern already established here, trading Iranian tankers for the ships shot at rather than striking Iran's military directly. Whether that exchange rate holds is the thing to watch next.
US markets are closed for Labor Day, so there's no equity reaction to attach to this yet. Asia had one: the Nikkei closed up 2.12% and the Kospi 4.61%, led by chipmakers, with SK Hynix and Samsung both higher, per CNBC. A semiconductor rally sitting on top of a war headline is not the same evidence as a US session absorbing a carrier attack and staying calm. The S&P 500 hub makes that case for US equities; there's no fresh US session yet to test it against.
This doesn't move the WTI-above-$80 call, and the pending USO strangle stays pending. WTI at $92.71 sits more than $12 above $80. I pulled a live USO chain today and the only listed expiries were two and four days out, too short for the multi-week volatility trade this strangle is supposed to express. I'm not forcing a weekly structure onto a slower-moving story, so that row in the log below stays unpriced.
Updated September 2, 2026, 11:00am ET: the US struck Iran across multiple sites, Iran hit back at three countries, and WTI jumped 5.2% to a five-week high
Trump's threat from Monday landed Tuesday. CENTCOM said US forces struck Islamic Revolutionary Guard Corps air-defense sites, radar systems, maritime facilities, mine-laying capability and communications sites inside Iran, in a wave that began around 7:30pm Tehran time (noon ET) on September 1, per Tribune India's report on the CENTCOM statement. CENTCOM framed it as a response to the tanker attacks and threats to US personnel this piece already had on the record.
Iran says the strike killed civilians at a wedding. Iran's Foreign Ministry says shrapnel from a US strike hit a home in Kuhestak, in Sirik county of Hormozgan province, during a wedding celebration, killing at least four to five people and wounding roughly 50, mostly women and children, per Al Jazeera and RTE, both citing Iranian officials and the Red Crescent. That is Iran's own account of its own casualties. Neither the US nor an independent body had confirmed a toll as of this writing, and the exact split between killed and wounded varies by a person or two between the two outlets.
Iran retaliated against three countries at once, not one. Iran's Revolutionary Guard fired ballistic missiles at Jordan's Prince Hassan air base and at Camp Titin, a Marine base, sent drones at Bahrain's Sheikh Isa base, and hit assets in Iraq, per the CENTCOM-adjacent reporting above. Jordan's military says it intercepted the missiles aimed at it; outlets disagree on the exact count (10 of 13 versus all 13), so I'm not putting a precise number on that one. No casualties have been reported at any of the three bases.
Benchmark Prior update (Monday premarket) Tuesday, Sept 1 WTI roughly $87 $90.22 settle, up $4.46 (+5.20%) Brent roughly $92 roughly $95, up about 5%, the highest since late July WTI's move is the one I'd hang a number on: $90.22 against Monday's $85.76 settle is +5.20%, and that's the same percentage move reported independently of the dollar figure, so the two reconcile. Brent's "roughly $95" is a rounder read from the same reporting; both benchmarks are trading a touch below that Tuesday high on Wednesday morning, per TradingEconomics, which had WTI near $90 and Brent near $95 as of this writing, both essentially flat to slightly down on the day.
This is a step past the pattern I've been tracking. Every prior update in this thread was one side hitting the other and the other claiming to have absorbed it cleanly (Sunday's Larak Island strike, Sunday night's tanker hits, the "did Iran's response actually land" question from August 31). This is the first round where the US hit inside Iran at multiple sites in one wave, Iran's retaliation spread across three countries' bases instead of one, and there's a specific, ugly, contested casualty claim attached. None of that is enough on its own to prove the conflict is spiraling rather than staying inside its established band; wider retaliation with zero reported casualties on the US, Jordanian, Bahraini or Iraqi side is also consistent with a tit-for-tat that both sides are still keeping inside limits. But "bigger and wider, same day" is a different shape than the single-incident pattern this hub has tracked since mid-August, and it's worth naming as a change in kind, not just degree.
The read-through to this morning's bond selloff runs straight through the barrel price. The 10-year Treasury yield hit 4.814% Wednesday, its highest since November 2023, and CNBC attributed part of that move to oil trading near $95 a barrel feeding inflation expectations. The September Fed hub already had hike odds at 60-66% before today; a weak ADP print this morning (private payrolls +38,000 in August against a 47,000 forecast, the slowest month since January, per ADP) is the kind of soft labor data that would normally argue the other way. Oil-driven inflation fear and a soft jobs print are pulling the rate debate in opposite directions on the same morning, and I don't think either one has won yet. The Fed hub is where that gets settled; this update is just the mechanism.
None of this moves the WTI-above-$80 call or closes the pending USO strangle in the log below. WTI at $90 is $10 clear of that line, same as it's been for two weeks. The strangle stays unpriced. If the conflict's wider footprint today (three countries, not one) is the thing that finally moves an options desk to quote USO vol at a level worth logging, that's the next update I'd want to write.
More on $USO: Iran Declared the Strait of Hormuz Closed. Oil Went Up 3% →
Updated September 1, 2026, 8:20am ET: two more tankers hit in Hormuz, and Trump says the US will "hit them hard"
Two loaded supertankers were struck by unknown projectiles in quick succession late Monday night, per the maritime security firm Marisks: the VLCC Sidr, run by Saudi Arabia's Bahri, and the Liberian-flagged Senegal Prosperity, operated by South Korea's Sinokor, both hit roughly 17 nautical miles east of Khasab, Oman while exiting the strait outbound. Each had loaded 2 million barrels of Saudi crude at the Juaymah terminal the week before. The Senegal Prosperity alone took three projectiles, to the port side, the engine room and a ballast tank, and lost communications. Both crews are reported safe and neither report mentions a spill.
President Trump threatened more strikes on Iran the same day, telling reporters the US is "going to hit them hard" and that "there will be a response," per CNBC. That is a second US-side escalation signal inside two days, on top of Sunday's strike on Iranian rocket launchers the update below already covers.
| Benchmark | Monday settle | Change | Tuesday premarket | |---|---|---| | WTI | $85.76 | +$2.36, +2.83% | roughly $87 | | Brent | $90.49 | +$2.39, +2.71% | roughly $92 |
Monday's settle is the number I'd actually hang a call on. The Tuesday premarket reads I found run $86.50 to $87.50 on WTI and $91 to $92 on Brent depending on the source and the minute, which is scattered but all pointing the same direction as the settle. Kpler shipping data cited alongside the strike puts Monday's strait traffic at five commodity vessels, a fraction of the roughly 130-a-day pre-war rate this piece cited back in August.
US equity futures leaned red on it: Dow futures were down roughly 269 points (0.5%), S&P 500 futures off about 0.5%, and Nasdaq-100 futures down closer to 1%.
Two loaded tankers hit minutes apart, both outbound, is a step up from the single-tanker, single-projectile pattern this piece has tracked since mid-August. I'm not ready to call that a new range on one night's data, but it is the kind of print that builds toward one if it happens again this week. It does not move the WTI-above-$80 call in the log below, and it argues for the unpriced USO strangle exactly as hard as last week's update did. I still don't have a live chain to price that one against.
Updated August 31, 2026, 10:40am ET: Iran says it hit two US bases and shot down a drone. Jordan and the UAE say nothing got through.
Iran's Revolutionary Guard Corps says it fired ballistic missiles at Jordan's King Hussein and Al-Azraq air bases, claiming to have destroyed "technical and maintenance infrastructure" there. It also says it targeted US personnel at a UAE air base and shot down a US drone over the strait. This is the retaliation the update above flagged as the thing that would actually move this call.
Jordan and the UAE describe a different outcome. Jordan's Armed Forces say they intercepted eight missiles that entered the country's airspace and destroyed them before any damage was done, per Al-Mamlaka TV. The UAE's foreign ministry says its military intercepted one Iranian drone over its territorial waters. Neither government, nor the US, has confirmed the base damage or the downed drone Iran is claiming.
WTI traded at $85.29 and Brent at $90.39 as of this writing, per TradingEconomics, both up more than 2% on the day. That is a fresh high for the range this piece has tracked since mid-August. Equities opened lower and stayed there: the Dow was down roughly 0.7%, the S&P 500 about 0.4-0.5%, and the Nasdaq about 0.3-0.5%. Those reads come from AP and Yahoo Finance snapshots taken between premarket and mid-morning. All of it is Monday intraday, not a settled close, and it can move either way by 4pm.
My read is that the gap between Iran's claim and the interception claims matters more than either number on its own. A retaliation two host governments say did zero confirmed damage looks like Iran's response to the Soleimani strike in January 2020: loud, public, and built to look like payback without forcing an escalation nobody wants. If that holds, some of today's move is pricing "the war is back on" for a strike that, so far, hit nothing. The drone claim is the one piece that doesn't fit: Iran says it downed a US aircraft, and none of the interception statements address that either way.
None of this moves the WTI-above-$80 call in the log below. Oil was already $5 clear of that line before today. It doesn't change my answer on the strangle either. I still can't price it without a live chain, and a de-escalation read argues for that trade just as hard as an escalation one does: the position pays either way.
The US struck two Iranian rocket launchers on Larak Island Sunday, the first US military action in the strait in over a month. A US official said Revolutionary Guard forces were preparing to fire rockets carrying sea mines into the same shipping lanes CENTCOM had just finished clearing of mines the week before. Iran's Guard confirmed the strikes hit Larak Island, reported casualties among its own forces, and said the attack "will be met with a retaliatory response."
WTI traded near $84.61 and Brent near $89.46 in Monday's early electronic session, both up roughly 1.5% on the day as of this writing, per TradingEconomics. That is a fresh high for the range this piece has tracked since mid-August, further past the $80 ceiling the July call already lost.
US equity futures slipped but did not panic. CNBC had Dow futures down 85 points (0.16%), with S&P 500 and Nasdaq-100 futures each off about 0.2% Sunday night, a small move against a month where the S&P 500 and Nasdaq Composite were both headed for their first monthly gain since May, up roughly 3% and 4%.
Shipping through the strait was already thin before this: about 24 vessels transited last week, against roughly 130 a day before the war. A mine-laying attempt caught before it happened is not the same signal as one that succeeds, and futures markets look like they are pricing that difference rather than a new war. I am not moving the dead $80 ceiling call or closing the open WTI-above-$80 trade below on one overnight strike. What would move it is whether Iran actually retaliates, and against what.
TL;DR
- WTI traded around $82.40 late Friday, up about 1.4% on the day and roughly 5% on the week. Brent sat near $88.59. Both are OTC quotes taken after the NYMEX settle, so read them as late-Friday marks rather than official settlements.
- Energy gained roughly 6% on the week, the best of the eleven S&P 500 sectors, while the index itself slipped 0.17% to 7,786 on Friday after Thursday's record close of 7,798.99.
- The IEA put this quarter's shortfall at 1.8 million barrels a day on August 12, more than double its previous estimate and the deepest quarterly deficit since Q4 2021.
- Global stocks have drained 410 million barrels since the war began. Observed inventories dropped below 7.9 billion barrels in July, a first since April 2025.
- In July this site called crude a $70-$80 range and said to sell calls above $80. WTI is $82.40. That is a losing call, and the July piece named this exact level as the thing that would kill it.
The Board
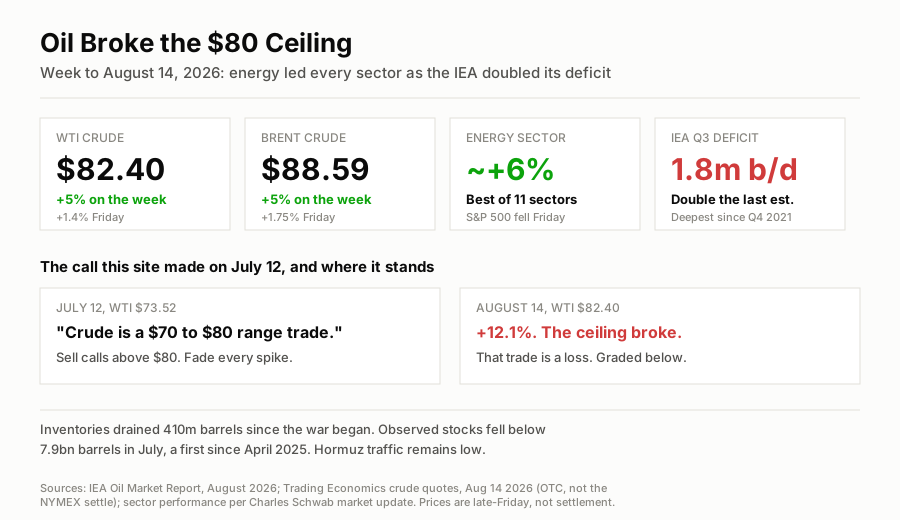
The week's numbers, and the call this site made a month ago at $73.52.
Why Is Oil Up?
The US Navy is still blockading Iranian ports, talks to reopen the Strait of Hormuz have stalled, and on August 12 the IEA said the resulting supply hole is twice as deep as it previously thought.
Treasury Secretary Scott Bessent said the administration will apply "measures like have never been seen in the history of economic isolation on a country," with details due next week, alongside "the continued blockade in the Strait of Hormuz that will keep anything from going in or out of the Iranian ports." Defense Secretary Pete Hegseth said the Navy can hold that blockade "indefinitely" by rotating ships through.
On the other side, Iran's security chief Mohsen Rezaei told China's ambassador that Washington has to end its military campaign and release frozen Iranian funds before the strait fully reopens. Those two positions do not overlap anywhere, which is most of why crude added 5% in a week.
Equities followed the barrel. Energy closed the week up roughly 6%, ahead of all ten other S&P 500 sectors and far ahead of an index that fell 0.17% on Friday, which you can see in the sector heatmap. Healthcare, tech and financials each managed something above 1%.
Worth noting how recent the reversal is. Oil fell on August 3 and again around August 10 on reports that a deal to reopen the strait was close. The same variable that took crude down twice this month took it back up when the talks stalled. Anyone trading this is trading one political headline with a wide distribution attached.
The Hole the IEA Found
The August Oil Market Report is where the week stopped being a headline and started being inventory arithmetic.
- This quarter's deficit: 1.8 million barrels a day, more than double the agency's earlier projection, and the deepest quarterly shortfall since Q4 2021.
- 2026 supply falls 4.3 million barrels a day, about 4%, to roughly 102 million b/d.
- 2026 demand falls 1.6 million barrels a day, as the closure and high pump prices eat consumption.
- For 2026 as a whole the deficit is the widest in five years.
Do the subtraction on the middle two and the picture is clear enough: supply is falling about 2.7 million b/d faster than demand is. That gap is what has drained 410 million barrels from global stocks since the war started.
The inventory line is the one I would watch hardest. A deficit is a rate; inventories are the buffer absorbing it, and buffers run out on a schedule you can actually calculate. Below 7.9 billion barrels puts observed stocks at levels last seen in April 2025, with the drain still running.
What I Got Wrong in July
On July 12, at WTI $73.52, this site published Oil Rose Just 5% When the Iran War Restarted. $100 Crude Isn't Coming. It gave four reasons crude was a $70-$80 range trade and recommended selling out-of-the-money calls above the $80 level and fading every spike with short-dated USO puts.
WTI is $82.40. Crude is up 12.1% since that piece. Selling calls above $80 into that move is a loss, and so is every faded spike along the way.
The specific errors, worst first:
"Closing Hormuz is a meme." That sentence has aged the worst. The July 13 follow-up, Iran Declared the Strait of Hormuz Closed. Oil Went Up 3%, argued the market was right to call the bluff because CENTCOM was escorting tankers through within hours. A month on, CNN reported on August 13 that Hormuz traffic remains low while the world burns through stockpiles to compensate. Whatever the declaration was worth in July, a month of reduced transits is a physical disruption.
"The supply cushion is real." It was real, and it is being spent, at 410 million barrels since the war began. Spare capacity and inventories absorb a deficit for a defined stretch of time, and the IEA's numbers now put a rough clock on that stretch.
The stated invalidation fired and I should say so plainly. That piece wrote: "Ceiling: $80. A close above it that holds is your first real signal the market is repricing this conflict as something bigger than contained." WTI has held above $80. By the article's own test, the range call is dead. I would rather be graded against a level I published than move the level and say nothing about it.
What Held Up
The headline call is still alive, and I want to be precise about how much of one that is.
$100 crude has not arrived. It was 36% away in July and it is 21.4% away now, so the gap has closed by a lot while the call technically holds. The demand argument is the piece of that reasoning still doing real work: the IEA has 2026 demand falling 1.6 million b/d, and the war is genuinely suppressing consumption at the same time it suppresses supply. That is the only thing standing between $82 and a much worse number.
The July argument that second-time shocks are cheaper than first-time shocks also held. April's spike above $126 remains the high. Crude has re-rated about 12% in a month without anything resembling panic. The move came in steps, on specific news, with two down legs inside it.
The Options Angle
I am not fading this rally, and given I spent July telling readers to fade it, that reversal is the whole content of this section.
The setup that argued for selling premium was a range with a hard political ceiling. The ceiling went. What replaced it is a market where one headline moves crude 5% in either direction, twice in the same month, with a real inventory deficit underneath. Selling out-of-the-money calls into that collects a small credit against a tail that is now paying out.
Owning volatility rather than direction is the cleaner expression, a strangle on USO being the obvious shape, because a signed reopening deal is worth as much to the downside as a further escalation is to the upside. I could not source a live USO chain on a Friday evening, so I am not putting a price on that structure and it goes in the log as pending rather than as a play with an entry.
What would change my mind: a verifiable reopening, meaning tanker transits recovering in ship-tracking data rather than an announcement. That was the right indicator in July and it still is.
Bessent's measures are due in the week of August 17, which lands them in the middle of retail earnings season. The week ahead is built around Walmart, Target, Home Depot and the Fed minutes, and none of those companies enjoys a fuel bill going up.
Trade log
| # | Stance | Structure | Strikes and expiry | Cost or credit | Spot at writing | Implied move | Conviction | Breakeven |
|---|---|---|---|---|---|---|---|---|
| 1 | Bullish | WTI holds above $80 through end-September | Spot crude, no option leg | No premium paid | $82.40 WTI, Aug 14, late Friday OTC quote | n/a | 6/10 | Any WTI close under $80 is a loss |
| 2 | Pass | Re-entering July's short call / long USO put trade | Would have been OTM calls above $80, 30-45 days | Credit not sourced | $82.40 WTI, Aug 14, late Friday OTC quote | n/a | 7/10 | Scored against whether fading pays from here |
| 3 | Pending | Long strangle on USO | Not struck, no live chain sourced | Not priced | $82.40 WTI, Aug 14, late Friday OTC quote | not sourced | 5/10 | Needs a move either way; unpriced |
Row 3 carries no entry on purpose. Section 8 of the house rules allows a play quoted against the implied move when a chain cannot be sourced, and I could not source either, so it stays pending until it can be priced.
The One-Line Read
The supply deficit is real and my $80 ceiling is gone, but the whole move still rests on one blockade that both sides say the other must end first. I have stopped selling the rally. I am not buying $100 either.
Next up:PCE inflation, tomorrow at 8:30am ET →
More on $USO
Updated Every Saturday
The Week Ahead
Every earnings date, Fed event and setup for the current trading week, on one page.
Refreshed Weekly
Earnings Calendar
Who reports next, when, and what consensus and the whisper expect.
The Week-Ahead Brief
Don’t miss next week’s setups. Get the Sunday brief.
Latest issue, Sep 27“Micron, PCE and the jobs report that decides October”
Every Sunday: next week’s earnings dates, Fed days and the trades worth watching, from the same desk that writes the week-ahead hub. Free, built for retail investors.