Russell 2000 Record High: Small Caps Are Beating the AI Trade
The Russell 2000 closed at a record 3,045.48, up 22.7% in 2026 against the Nasdaq 100's 19%. What is driving it is the collapse in September Fed hike odds, and that carries a dated risk.
TL;DR
- The Russell 2000 closed at a record 3,045.48 on August 12, its 27th record close of 2026, taking out a previous peak of 3,036.98. It traded near 3,067 intraday on Thursday.
- Small caps are up 22.7% in 2026 against 13.2% for the S&P 500 and 14.4% for the Nasdaq Composite. The Russell is also ahead of the Nasdaq 100's roughly 19%.
- This is a rates trade, not an earnings trade. September hike odds have collapsed from a coin flip on Tuesday to somewhere in the 30s after Thursday's flat PPI, depending on which source you take.
- The S&P 500 cleared 7,800 intraday for the first time on the same session, and the chip complex added about 1.8%, so nothing here is small caps beating tech in a down tape.
- The risk is dated: September 11. August CPI is the first print to carry the post-ceasefire oil move, and the small-cap bid is the most rate-sensitive thing in the market.
More on $IWM: 57,000 Jobs. The Report Everyone Ignored Is the Scariest Number on the Board →
Why Are Small Caps at a Record?
Because the market stopped expecting a September rate hike. The Russell 2000 is stuffed with companies that borrow at floating rates and refinance often, so the path of the funds rate moves them more than it moves a mega-cap with a fortress balance sheet and a decade of fixed debt.
Watch the sequence rather than any single quote. Hike odds sat near 58% just after the July 29 FOMC. They collapsed toward a 60% hold on the July payrolls miss, drifted back to roughly 50/50 by Tuesday as Brent recovered, then fell again through this week's inflation data. After Wednesday's CPI, CME's FedWatch put a hike near 42%. After Thursday's producer prices, quotes ran into the low 30s.
The data behind that: July CPI at 3.4% and July PPI unchanged on the month, with the annual rate down to 4.7% from 5.5%. Two cool prints in three days, into a committee that is already split.
The Board
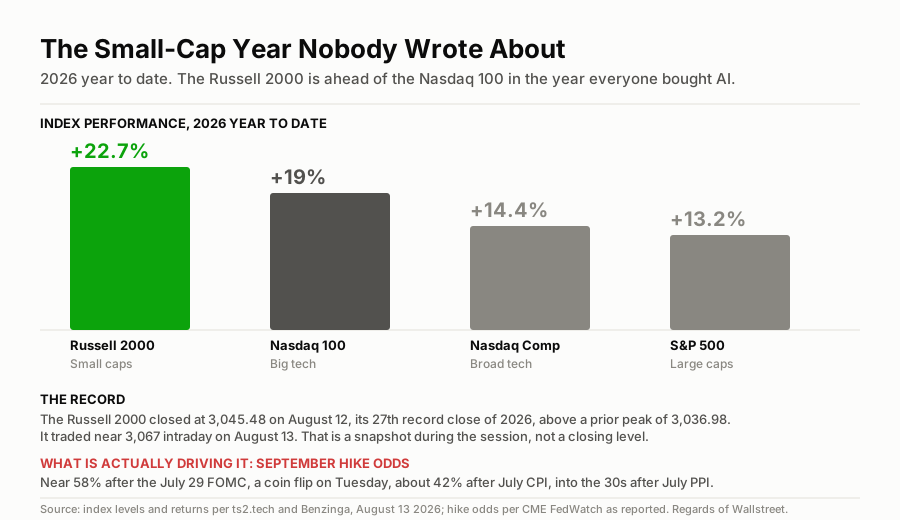
Four indices, one year. The one full of small domestic borrowers is winning it.
The Index Everyone Called Dead Money
Small caps have underperformed for most of the post-2020 era, and the standard explanation was structural: the Russell is full of companies that do not earn anything, while the index that mattered owned the AI buildout. That explanation has been wrong for eight months.
Up 22.7% against 13.2% is a 9.5 point lead over the S&P 500. The comparison I find more striking is the Nasdaq 100 at roughly 19%, because 2026 has been, by any narrative measure, an AI year. Chips led again on Thursday, with the sector index up about 1.8% and both Sandisk and Micron among the S&P's biggest gainers. Small caps still beat them year to date.
What changed is not that small caps got better. Rates got friendlier and the discount rate applied to a company with no profits for three years is where that shows up first. The iShares Russell 2000 ETF holds close to 40% of its weight in financials and healthcare, per the fund's own breakdown, and those are the two sectors that live and die on the curve: banks on net interest margin and credit, early-stage biotech on the present value of cash flows that arrive in 2032.
Olga Bitel of William Blair Investment Management framed the tape this week as "markets are holding up fairly well due to solid economic growth that is picking up pace". I would put slightly more weight on the rate path and slightly less on growth, but the two are hard to separate in a month when payrolls fell and stocks rose.
What Would Break It
September 11, at 8:30am ET.
That is the August CPI, and it is the first inflation report to contain the energy move that followed the ceasefire. The Cleveland Fed's nowcast has been pencilling in a 0.38% monthly headline jump for August against July's 0.1%. If something near that arrives, every basis point of this month's repricing goes into reverse, and the most rate-sensitive index in the market takes it hardest.
There is a second thing I would watch that is less discussed. The Fed still has an October and a December meeting, and as of last week CME's tool priced a hike near 55% for October and close to 75% by December. That pricing may have softened this week along with September, but the market never called off the tightening cycle. It postponed one meeting. A rally built on that distinction is a rally with a short fuse.
The committee itself is not comfortable. July's hold drew three dissents in favour of a hike, the most since September 2016, and Chair Kevin Warsh has stripped forward guidance out of the statements, so there is no verbal cushion between now and the data.
Is IWM a Buy Here?
Not at a record on rate-cut hope alone, and I want to be specific about why rather than fence-sit.
The bull case is real and I would not dismiss it: two cool inflation prints, a Fed that has now been talked out of one hike, an index trading at a wide valuation discount to large caps, and a real earnings recovery in domestic cyclicals if the economy is genuinely accelerating. Broadening leadership is what a healthy bull market looks like, and this one has broadened.
The bear case is that almost none of that is why the index is up this week. The move maps onto hike probabilities almost tick for tick, which makes this a levered position on a single data release four weeks out, dressed as a rotation. Buying an index at its 27th record close of the year, immediately before the one print the nowcast says will look bad, is paying full price for the good news and taking the bad news for free.
Where I would rather be is in the specific balance-sheet stories inside the index rather than the index itself, since those pay off on a deal closing rather than on a CPI print. Red Robin's refranchising deal today is that shape: a 26% move driven by an asset sale worth half the market cap, and the Fed has no vote on it. Where the money went across sectors is on the heatmap.
No options play logged here. I would want to see August CPI positioning in the IWM chain before writing a directional structure into a record high, and the implied levels I could source this afternoon were not ones I would stand behind as an entry.
The One-Line Read
The Russell's record is a bet that Warsh does not hike in September. It is a good bet on Thursday's data and a fragile one on September 11, and the index has already been paid for being right.
Next up:PCE inflation, Wednesday at 8:30am ET →
More on $IWM
Updated Every Saturday
The Week Ahead
Every earnings date, Fed event and setup for the current trading week, on one page.
Refreshed Weekly
Earnings Calendar
Who reports next, when, and what consensus and the whisper expect.
The Week-Ahead Brief
Don’t miss next week’s setups. Get the Sunday brief.
Latest issue, Sep 20“The week after the hike: two housing reads and Costco earnings...”
Every Sunday: next week’s earnings dates, Fed days and the trades worth watching, from the same desk that writes the week-ahead hub. Free, built for retail investors.