Toll Brothers (TOL) Earnings Aug 18: Orders Up, EPS Down 22%
Toll Brothers reports fiscal Q3 after the close on August 18. Orders rose 8% last quarter while deliveries fell 14%, and the order growth is slower than the community growth behind it.
TL;DR
- Toll Brothers reports fiscal Q3 after the close on Tuesday, August 18, with the call at 8:30am ET on Wednesday. Consensus wants $2.90 per share against $3.73 a year ago, on total revenue near $2.6 billion versus $2.945 billion. That is a 22% earnings decline in a quarter the company itself guided to back in May.
- Orders grew 8% in dollars last quarter. The selling community count grew 9%. Divide one by the other and demand per community went slightly backwards.
- Margin is where Tuesday gets decided. Adjusted home sales gross margin has run 26.5% then 26.2% this year, and Toll guided Q3 to 25.25%. The full year is still guided at 26.1%.
- My arithmetic on that guide: the first three quarters produce roughly $1.80bn of adjusted gross profit on $6.94bn of home sales revenue, so Q4 has to land near 26.4% to reach 26.1% for the year. Last year's Q4 did 27.1%, so the ask is a step back up from Q3 rather than a record.
- The backlog identity closes exactly: 5,051 homes, plus 2,834 orders, minus 2,491 deliveries, is 5,394. That is the reported figure to the unit.
More on Earnings: Stock Market Week Ahead (Sep 21-25): Costco, AutoZone, KB Home and a 5% Ten-Year →
The Board
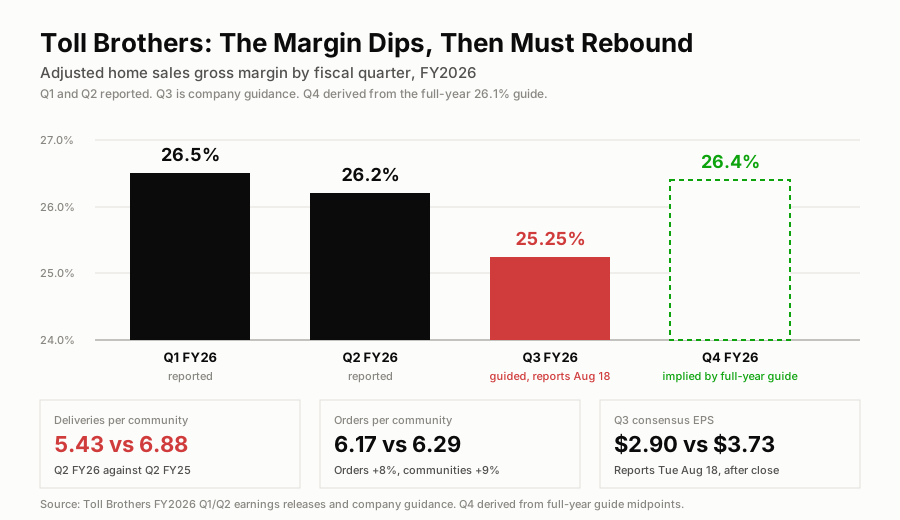
The margin steps down into Tuesday's quarter, and the full-year guide needs it to step back up straight afterwards.
When Does Toll Brothers Report Earnings?
After the close on Tuesday, August 18, with the conference call the following morning at 8:30am ET. The quarter ended July 31. Toll's own announcement has Douglas Yearley Jr., now Executive Chairman, hosting alongside Karl Mistry, who took the chief executive job this year.
The split matters for the release-versus-call gap. Numbers hit Tuesday evening and the colour arrives fourteen hours later, so the Tuesday after-hours print trades on a table while the Wednesday open trades on the commentary. Those two sessions have disagreed before.
Consensus sits at $2.90 and roughly $2.6 billion of total revenue. Check which revenue line that is: home sales revenue was $2.88bn in the year-ago quarter and total revenue was $2.945bn, the difference being land sales and other income. Against the wrong one the decline looks like 10%; against the right one it is 11.8%.
The 8% That Was Really 9%
Toll's second quarter read well in the headline. Net signed contracts rose 7% in units and 8% in dollars, to 2,834 homes and $2.81bn, and management raised full-year guidance across the board on the strength of it.
Underneath, selling communities went from 421 to 459, up 9%. So Toll ran about 9% more stores and wrote about 7% more contracts. Per community that is roughly 6.29 orders falling to 6.17, which is a small decline, and I would not build a bear case on 2%. But it does mean the order growth came from opening communities rather than from selling more homes in the ones already open, and opening communities costs land, capital and overhead. SG&A went from 9.5% of home sales revenue to 10.3% over the same stretch.
The delivery side of that ledger is harsher. Toll delivered 2,491 homes last quarter against 2,899, down 14%, on 9% more communities. That is 5.43 deliveries per community against 6.88, a fifth less throughput per store.
Where the Margin Goes
Adjusted home sales gross margin, which strips out interest and inventory write-downs, has gone 26.5% in Q1 and 26.2% in Q2 against 26.9% and 27.5% in the year-ago quarters. Both beat the company's own guide, by 25 and 70 basis points.
Toll guided the July quarter to 25.25%, and that number is the one worth holding onto. The full-year guide is 26.1%, and the fiscal year does not end until October 31.
Here is what those two numbers do together. Take the guide midpoints: 2,650 deliveries at $975,000 gives about $2.58bn of home sales revenue in Q3, so the first three quarters bring roughly $6.94bn of revenue and $1.80bn of adjusted gross profit. The full-year guide of 10,400-10,700 deliveries at $985,000-$1,000,000 implies about $10.47bn for the year, and 26.1% of that is $2.73bn. The residue is $3.53bn of Q4 revenue carrying $0.93bn of gross profit, or about 26.4%.
I am not calling that guide heroic. Toll did 27.1% in last year's fourth quarter, so 26.4% is a decline year over year and the seasonal shape is normal: fiscal Q4 is always the big one, and last year it delivered 3,443 homes. The point is narrower. The full-year number holds only if the July quarter is the floor. A Q3 print below 25.25% pushes the entire shortfall into a quarter that is already carrying a third of the year.
Watch the average price alongside it. Deliveries averaged $1,009,000 last quarter, and Toll guided Q3 to $965,000-$985,000. Part of the revenue decline is mix moving down the price ladder, which is a different problem from selling fewer homes.
The Backlog Number That Reads Worse Than It Is
Backlog was $6.32bn and 5,394 homes at the end of April, against $6.84bn and 6,063 a year earlier. Down 11% in units, and it has been down all year: $6.02bn against $6.94bn at the January quarter too.
That comparison is against a peak. Sequentially the book grew, and it grew by precisely the gap between orders and deliveries: 5,051 homes at the end of January, plus 2,834 signed, minus 2,491 closed, is 5,394. The identity closes to the unit, which is a small thing but it tells me the reported orders and deliveries are internally consistent before I lean on either.
A luxury builder also has a buffer most of the sector does not. On the Q2 call management put all-cash buyers at about 23% of the quarter and the loan-to-value on financed purchases near 69%. With the 30-year fixed averaging 6.67% in Freddie Mac's August 13 survey, a buyer putting nearly a third down absorbs a rate move that prices the entry-level buyer out, and why the rate itself has refused to move is the constraint the whole sector is trading around.
Tuesday Is a Housing Day
Housing starts and building permits land at 8:30am ET Tuesday, about eight hours before Toll's release, and Home Depot reports that morning with Lowe's the following day. Four housing reads inside thirty hours, in a week the week-ahead hub files as retail's. The dates for the rest of it are in the earnings calendar.
Toll is the cleanest of the four for one reason: Home Depot and Lowe's measure what people spend on houses they already own, and Toll measures whether they will buy a new one at a million dollars. The stock closed Friday at $148.27, down 0.70% on the session, against a 52-week range of $123.15-$168.36 and about 11 times earnings.
The One-Line Read
Toll is opening communities faster than it is selling homes out of them, and the full-year margin guide works only if July was the floor. Tuesday evening says whether it was.
Next up:PCE inflation, today at 8:30am ET →
More on Earnings
Updated Every Saturday
The Week Ahead
Every earnings date, Fed event and setup for the current trading week, on one page.
Refreshed Weekly
Earnings Calendar
Who reports next, when, and what consensus and the whisper expect.
The Week-Ahead Brief
Don’t miss next week’s setups. Get the Sunday brief.
Latest issue, Sep 27“Micron, PCE and the jobs report that decides October”
Every Sunday: next week’s earnings dates, Fed days and the trades worth watching, from the same desk that writes the week-ahead hub. Free, built for retail investors.