Fed Dot Plot September 2026: Nine Hike Dots, None of Them Warsh's
The September 16, 2026 dot plot put the 2027 median at 4.1% against June's 3.6%, erasing next year's cut, and the 2026 median at 4.1% too: one more quarter point after Wednesday's hike.
Show 1 earlier update
TL;DR
- The next dot plot publishes Wednesday, September 16, 2026 at 2:00pm ET, with the FOMC statement. Projections come four times a year, and the June set is the baseline being revised.
- June's dots: 9 members projected at least one 2026 hike, 8 a hold, 1 a cut, and the year-end median moved to 3.8% from 3.4% in March. That 3.8% is not a rate anyone can vote for; it is the midpoint of a committee split exactly in half, and the arithmetic is below.
- June also raised 2027 to 3.6% from 3.1% in March, so the same set of dots that added a 2026 hike took most of the following year's easing away with it.
- Chair Warsh filed no projection in June and has argued against forward guidance since taking the chair. If a dot appears under his name in September, it will become its own signal.
- Both big releases are in. August payrolls rose 162,000 on September 4, and August CPI's core ran a tenth hot on September 11. A September hike is priced at roughly 85-86%.
When Is the Next Fed Dot Plot?
September 16, 2026, at 2:00pm ET, alongside the rate decision at the September 15-16 meeting. The Summary of Economic Projections comes out at March, June, September and December meetings, so this is the first look at the committee's rate path since June 17, and the first since summer data started pulling the Fed between fighting inflation and supporting the jobs market. Both land inside a week that carries almost no earnings, which the week-ahead hub lays out day by day.
What the June Dots Actually Said
Before looking at September, it helps to start with June. Nine Fed officials expected at least one rate hike in 2026, eight expected no change, and one expected a cut. The Fed’s median forecast for the year-end rate rose to 3.8%, up from 3.4% in March.
3.8% is not a rate. It is a tie.
The projections are stated as the midpoint of a target range, and ranges come in quarter-point steps. Holding at 3.50-3.75% through December is a midpoint of 3.625%, printed as 3.6. One hike, to 3.75-4.00%, is 3.875%, printed as 3.9. So no participant can put a dot on 3.8.
Eighteen people filed, so the median is the average of the ninth and tenth. Sort them: one cut at 3.4, then eight holds at 3.6, then nine hikes at 3.9. The ninth dot is a hold and the tenth is a hike, and (3.6 + 3.9) ÷ 2 = 3.75, which the Fed prints as 3.8.
That matters for how the number gets read. A 3.8% median does not mean the committee expected a hike; it means the committee could not agree on one, by a single dot. Coverage that treats it as a Fed forecast of one quarter-point increase, this site's earlier version of this page included, is reading a coin flip as a decision.
The rest of the June set, and the part nobody quotes
Per the Fed's own table: PCE inflation for 2026 revised up to 3.6% from 2.7% in March, core PCE to 3.3% from 2.7%, and GDP growth trimmed to 2.2% from 2.4%. That inflation revision proved the Fed no longer expected inflation to improve much in 2026.
The line that got almost no coverage sits one column to the right. The 2027 median went to 3.6% from 3.1% in March, and 2028 to 3.4% from 3.1%, while the longer-run rate stayed at 3.1%. Read across, June said: raise this year, take back one cut next year, and get to neutral later than we told you in March. Against a 2027 median of 3.6% and a 2026 median of 3.8%, the committee's own path is a hike and then a single cut, not a hike and a return to easing.
That is the column to watch on Wednesday. The 2026 dot stops being a forecast at 2:00pm, because the vote settles it. Everything the projections still say about policy after that lives in 2027.
The Missing Dot
Warsh does not file one. In June, his first projections meeting as chair, he submitted no rate projection at all, consistent with his long-stated view that dot plots are forward guidance the Fed should not be giving. His Jackson Hole speech repeated the no-guidance position on his 100th day in the job. Given all that, we don't expect a projection from Warsh.
The September dot plot will show whether the Fed as a whole has become more or less hawkish since June. Three things matter, and the third has changed since this page was written: whether the nine officials expecting a hike become more or less numerous, whether more officials start projecting a cut, and, now that the 2026 column will be settled by the vote itself, where 2027 lands against June's 3.6%.
What Moves the Dots Between Now and Then
In order of weight:
September 4, August payrolls: released, and stronger than expected. Payrolls rose 162,000, more than double the highest estimate, per the Bureau of Labor Statistics. July's minus 23,000 was revised to plus 21,000, so the negative print that built the case for a hold in August is no longer in the data. Two caveats. Restaurants and local school hiring supplied 101,000 of the 162,000, a narrow base for a rebound. And wage growth slowed to 3.1% year over year, the one line in the report that argues against a hike. The jobs hub has the full breakdown.
September 11, August CPI: released, and hot where it counted. Headline held at 3.4% year over year, dead on consensus, but core rose 0.3% on the month against a 0.2% consensus, per the Bureau of Labor Statistics. It landed inside the blackout window, so no official has spoken to it and none will before Wednesday. The full print is on the CPI hub.
Oil is the one input the dots can move on that the vote cannot settle. Crude has swung with the Iran war, above $100, then below $80 on the US-Iran pause, and higher again as the conflict worsened. Energy does not sit in core, so it barely touches the 2026 dot at this point in the year. It sits squarely in the 2027 PCE projection of 2.3%, which assumes energy stops adding to the price level. A committee that no longer believes that has to move 2027 up, and 2027 is the column that still carries information after 2:00pm.
Full runway on the economic calendar.
The Board
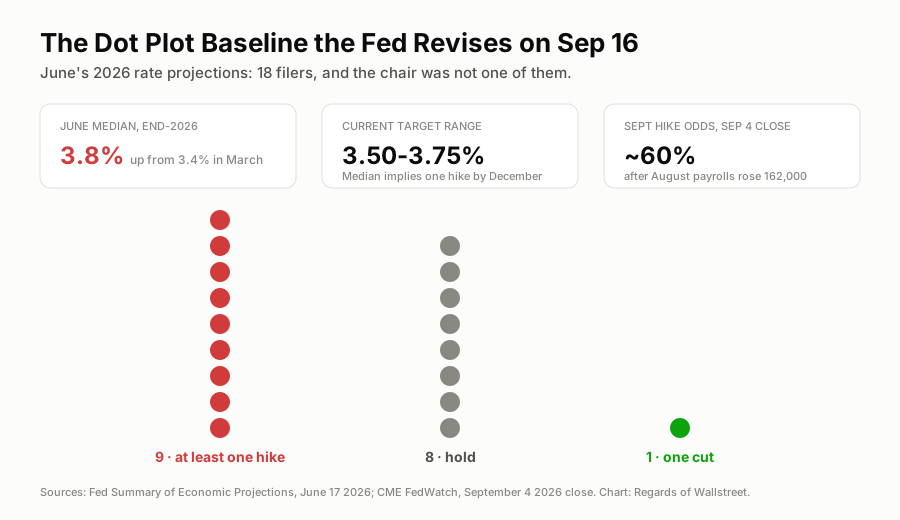
The June grid: nine dots above the line, and none of them the chair's.
The One-Line Read
June's 3.8% median was a committee split down the middle rather than a forecast of a hike; September answered the question this page said mattered, moving the 2027 median to 4.1% from 3.6% and erasing next year's cut.
Next up:Fed decision, Tue, Oct 27 →
More on $SPY
$SPY · 2026-10-10
Stock Market Week Ahead (Oct 12-16): JPMorgan and the Big Banks, September CPI, TSMC, and the Last Fed Speeches Before October 28
$SPY · 2026-09-27
Stock Market Week Ahead (Sep 28-Oct 2): Micron Earnings, PCE Inflation, and the Jobs Report That Decides an October Fed Hike
$SPY · 2026-09-25
Options Scorecard: No New Grades This Week, and an Analog Devices Round Trip
Updated Every Saturday
The Week Ahead
Every earnings date, Fed event and setup for the current trading week, on one page.
Refreshed Weekly
Earnings Calendar
Who reports next, when, and what consensus and the whisper expect.
The Week-Ahead Brief
Don’t miss next week’s setups. Get the Sunday brief.
Latest issue, Oct 11“September CPI, the big banks and TSMC: earnings season starts”
Every Sunday: next week’s earnings dates, Fed days and the trades worth watching, from the same desk that writes the week-ahead hub. Free, built for retail investors.