Oracle Has Sold 9.5 Years of Revenue. Palantir Has Sold 0.8. We Built the Table.
A free dataset of every big RPO and backlog disclosure, with the ratio nobody publishes: contracted revenue over trailing sales. Oracle 9.5x, Microsoft 2.0x, Palantir 0.8x, Boeing 7.6x.
TL;DR
- We launched the RPO and Backlog Coverage Tracker: every large contracted-revenue disclosure in one table, with the number nobody publishes properly next to it. Coverage is the contracted balance divided by the trailing twelve months of revenue it converts into, so a $678 billion backlog and a $4.9 billion backlog can finally be read on the same page.
- Across 11 companies and $3.3 trillion of contracted revenue, the median company has signed 3.3 years of its current sales. The range runs from Palantir at 0.80x to Applied Digital at 58.9x, which is 74 times, and most of that spread is definitional rather than commercial.
- Boeing sits at 7.6x, wider than Amazon's cloud backlog and just above Alphabet's. Nobody calls Boeing a bubble, because everyone already understands that an aircraft backlog converts over a decade. That is the frame the AI names deserve too.
- Only 2 of 11 companies publish a weighted average duration, and only 3 give a 12-month split. A backlog without a duration is unfalsifiable: $638 billion over five years and $638 billion over fifteen are different companies.
- It is CC BY 4.0: take the JSON or the CSV, chart it, republish it. Attribution with a link is the whole price.
More on AI & Semiconductors: Options Scorecard: The Week of August 24, Graded (4 Calls, 75% Right) →
The Board
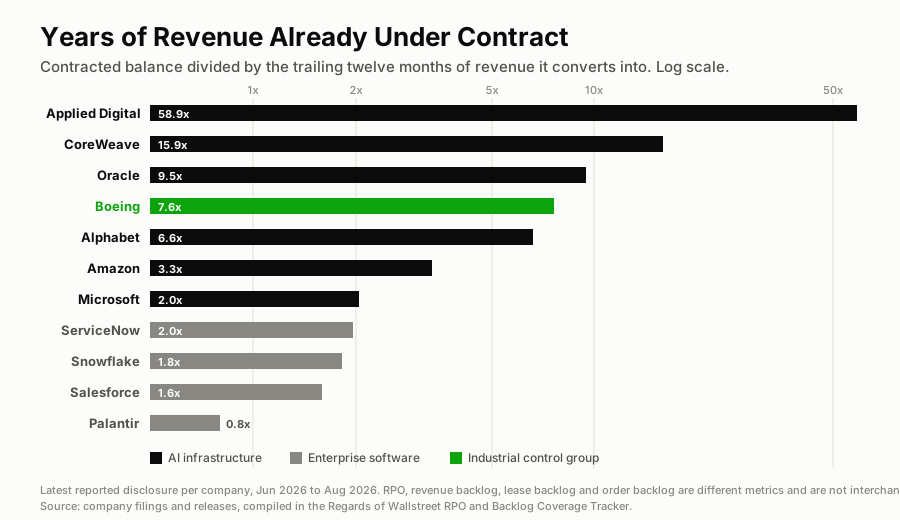
The scale is logarithmic because the spread is two orders of magnitude. The green bar is the company nobody is arguing about.
How Many Years of Revenue Has Each Company Already Signed?
Oracle has signed 9.5 years of its current sales, Microsoft 2.0, Amazon's cloud business 3.3, and Palantir less than one.
Those four numbers do more work than every headline dollar figure published this earnings season. Microsoft's $678 billion of commercial remaining performance obligation was the disclosure that stopped a fortnight of AI capex scepticism and moved the stock about 8%, as we covered in the Microsoft breakdown. Oracle's $638 billion is smaller in dollars. Against the business underneath it, it is nearly five times larger.
That is the entire argument for this dataset. Contracted revenue is meaningless without the revenue it is contracted against, and almost nobody does the division. RevenueRemainingPerformanceObligation is a standard XBRL tag that every large company files, which makes the absence of a clean cross-company table faintly ridiculous.
If you want the metric itself explained first, we wrote what RPO actually is: deferred revenue plus contracted-but-unbilled, and the four traps that come with it.
The Software Band, and What Sits Above It
Twenty years of subscription software have produced a well understood shape, and three rows here show it: ServiceNow at 2.0x, Snowflake at 1.8x, Salesforce at 1.6x. Roughly half of each balance lands inside twelve months, disclosed as cRPO every quarter. That band is what a backlog looks like when it is a billing convention.
Above about 5x, a backlog stops being a billing convention and becomes a construction schedule. Alphabet at 6.6x and Oracle at 9.5x are selling capacity that does not exist yet and will be delivered over years, which is a different business from selling more seats faster. CoreWeave at 15.9x and Applied Digital at 58.9x are the pure version of that: companies whose contracted revenue is enormous precisely because their current revenue is tiny and the buildings are not built.
Microsoft, interestingly, sits at the bottom of the AI group at 2.0x, in the software band. The largest backlog in corporate history belongs to the company that is closest to already earning it.
Boeing Is the Control Group
Boeing carries a record $715 billion backlog, $597 billion of it commercial aircraft, against $94 billion of trailing revenue. That is 7.6x: wider than Amazon's cloud backlog, and above Alphabet's. Boeing's own results, which we covered when the stock rose 4.8% on a $428 million loss, were not treated as evidence of a mania.
Nobody panics about it because everyone already knows what an aircraft backlog is: over 6,200 aircraft against 171 delivered in the quarter, which is about nine years of production at the current rate. The constraint is the factory, not demand. Read that sentence again and then reread Oracle's 9.5x, because the AI backlog debate, put in Boeing's terms, is not "is this real", it is "how long is the queue and who is standing in it".
The difference, and it is a real one, is that aircraft orders have decades of conversion history and AI compute contracts have about eighteen months.
The Duration Column Is Nearly Empty
Here is the finding that surprised me most while building this. Of eleven disclosures:
- Two publish a weighted average duration. Microsoft (2.3 years, including OpenAI) and Applied Digital, whose newest leases run 15 years.
- Three publish a near-term split: Microsoft's 30% within 12 months, and the cRPO figures from ServiceNow ($13.20 billion of $29 billion) and Salesforce ($33.6 billion of $67.9 billion).
- Alphabet gives a 24-month split instead, just over 50%, which is a genuine disclosure and is not comparable with anyone's cRPO.
- Oracle, holder of the widest coverage ratio of any large company on record, publishes neither.
The empty cells are the story. A backlog quoted without a duration is the flattering half of a number, and the market has been rewarding the headline while the schedule stays undisclosed. My read is that this is the next disclosure norm to fall: Microsoft has now made duration and an ex-largest-customer growth rate look like table stakes, and Oracle's silence gets more conspicuous every quarter.
Percentage of What? The Amazon Problem
Amazon disclosed $496 billion of cloud commitments at Q2, up from $364 billion three months earlier. Against AWS trailing revenue of $148.4 billion, that is 3.3x. Against Amazon's total trailing net sales of $775.6 billion, it is 0.64x.
Both are true. They support opposite headlines. So every row in this tracker states the scope of the numerator and the denominator, matches them where the company publishes a matching revenue line, and flags the one row where it cannot: Microsoft reports commercial RPO but does not publish a commercial revenue line, so its 2.0x is measured against total company revenue and understates the real figure. That row carries a dagger rather than an invented denominator.
One more denominator trap, since companies lean on it: the ratio here is against trailing revenue, never an annualised run rate off the latest quarter. Amazon's backlog is 2.9x the AWS run rate and 3.3x AWS trailing revenue. A run rate is a forecast wearing a fact's clothing, and it flatters exactly when growth is fastest.
What This Ratio Cannot Tell You
Four things, and they are the reason the tracker is a table rather than a verdict:
- Nothing about margin. Most of Oracle's Q3 and Q4 backlog growth came from AI contracts where the customer prepaid for GPUs or supplied the hardware, roughly $75 billion of the balance. That revenue converts at nothing like software economics.
- Nothing about counterparty credit. More than half of Applied Digital's $36 billion is three leases with a single unnamed hyperscaler, against about $5 billion of debt on its own balance sheet, which we picked apart in the APLD breakdown.
- Nothing about the definition. Palantir's 0.80x is the lowest here despite 93% revenue growth, because its RPO counts only non-cancellable contracted revenue and much of its government work is cancellable. Ranking AI names by RPO alone would put Palantir last on demand, which is not what the number means.
- Nothing about cash. Alphabet has the second-widest coverage in this table and still posted its first negative free cash flow quarter since the 2004 IPO, on $44.9 billion of quarterly capex.
Coverage answers one question well: is the spending backed by commitments? It is a poor input to a target price and it is not a valuation.
Use It, Take It, Link It
The tracker lives at /data/rpo, sortable and filterable, with a per-company page for each name and every figure carrying its source, its scope and the arithmetic behind its denominator. The methodology explains which of the five metric types can be compared with which, and why lease backlogs and RPO are not the same animal.
It is licensed CC BY 4.0, which means you can chart it, republish it, feed it to a model or build a product on it, including commercially. Attribution with a link is the only condition. The JSON ships the derived ratios so nobody has to recompute them, and the CSV is one row per disclosure for the spreadsheet crowd.
It pairs with the AI Compute Deal Ledger, which tracks the individual contracts as they are announced. This one tracks what the accounts say afterwards. Rows update when companies report, never on an estimate, and CoreWeave's Q2 print on August 11 is the next one due.
The One-Line Read
A backlog is only a number until you divide it by the business underneath it, and doing that division for eleven companies turns the loudest argument in the market into something you can actually check: Oracle has sold nine and a half years of itself, Microsoft two, Palantir less than one, and Boeing seven and a half without anyone losing sleep, which suggests the useful question was never how big the backlog is, but how long the queue takes to clear and who is standing in it.
Next up:PCE inflation, Wed, Sep 30 at 8:30am ET →
More on AI & Semiconductors
Updated Every Saturday
The Week Ahead
Every earnings date, Fed event and setup for the current trading week, on one page.
Refreshed Weekly
Earnings Calendar
Who reports next, when, and what consensus and the whisper expect.
The Week-Ahead Brief
Don’t miss next week’s setups. Get the Sunday brief.
Latest issue, Sep 7“Week ahead in the stock market...”
Every Sunday: next week’s earnings dates, Fed days and the trades worth watching, from the same desk that writes the week-ahead hub. Free, built for retail investors.