What Is a Bear Steepener? Why Stocks Fell 2% When the Fed Did Nothing
The 2-year fell to 4.236% while the 30-year jumped to 5.193%. That shape is a bear steepener, and it explains a 2.19% Dow drop on a day the Fed changed nothing.
TL;DR
- A bear steepener is when long-term yields rise faster than short-term yields. "Bear" refers to bonds, because rising yields mean falling bond prices.
- It happened on July 29, textbook. The 2-year yield fell 4bp to 4.236% while the 10-year rose above 4.67% and the 30-year jumped more than 9bp to 5.193%. Short end down, long end up.
- This is the most uncomfortable curve shape a central bank can produce, because it says the market expects easy policy and higher inflation at the same time. It is a vote of no confidence in the long-run inflation target, not in the next rate decision.
- Three things cause it: stronger growth or inflation expectations, a rising term premium, and heavier Treasury supply. All three are arguably live.
- It hits equities mechanically, through the discount rate, and unevenly. On July 29 technology fell 2.36% and industrials 3.42% while energy and consumer defensives finished green. That dispersion is the signature.
More on $TLT: 20-Year Bond Auction Aug 19: The 5.245% Record Line, an Hour Before the Fed Minutes →
What Is a Bear Steepener?
Long yields rising faster than short yields, which makes the yield curve steeper while bond prices fall.
Take the terms apart, because the jargon is doing real work.
"Steepener" describes the shape. The yield curve plots yields against maturity. When the gap between long and short yields widens, the curve gets steeper. When it narrows, it flattens.
"Bear" describes the direction, and it refers to bonds rather than stocks. Bond prices and yields move inversely, so rising yields mean a bond bear market. A bear steepener steepens the curve by pushing the long end up. A bull steepener steepens it by pulling the short end down, usually when the market expects rate cuts. Same shape change, opposite meaning.
Here is the July 29 curve, which is as clean an example as you will find:
| Maturity | Move | Level |
|---|---|---|
| 2-year | down 4bp | 4.236% |
| 10-year | up about 7bp | above 4.67% |
| 30-year | up more than 9bp | 5.193% |
The short end went one way and the long end went the other, on the same afternoon, in response to the same Fed decision.
The Board
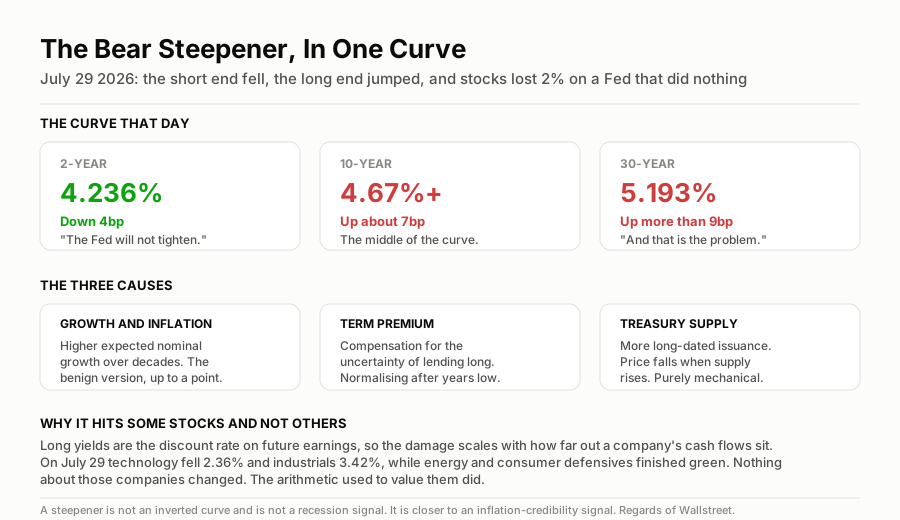
Short end down, long end up. That divergence is the whole message.
What It Actually Means
Different parts of the curve answer different questions. That is the key to reading this.
The 2-year answers: where will the policy rate be? It tracks expectations for the Fed over the next couple of years. On July 29 it fell, which is a dovish move. The market decided the Fed is not about to hike aggressively.
The 30-year answers: what will inflation and risk look like over decades? It is barely about the next few Fed meetings. It is about whether holding a claim on dollars for thirty years is a sensible thing to do.
So a bear steepener says: we do not think the Fed will tighten much, and that is precisely what worries us. The short end priced a Fed staying put. The long end priced the consequence of a Fed staying put with inflation unresolved.
That is why it is uncomfortable in a way a simple rate rise is not. If the whole curve rises, the market is saying policy will be tighter. When only the long end rises while the short end falls, the market is saying policy will be too loose, and it is charging more to lend for thirty years as a result.
On July 29 the context made it explicit. The Fed held at 3.50% to 3.75% on a 9-3 vote, with three members voting to hike. Chair Warsh said the Fed would not hesitate to stop inflation. The 30-year going through 5.19% was the bond market declining to take that on trust. Full detail in the Fed decision piece.
The Three Causes
Worth separating, because they have different implications and can operate together.
1. Growth and inflation expectations. If investors expect stronger nominal growth over decades, they demand more yield. This is the benign version, up to a point: a steepener driven by a genuinely stronger economy is not a crisis signal.
2. Rising term premium. This is the one that matters most now. Term premium is the extra compensation investors require for the uncertainty of holding long-dated bonds rather than rolling short ones. It is not about expected inflation, it is about being unsure. Term premium was suppressed for years by central bank buying and low volatility, and it has been normalising upward. A rising term premium lifts long yields with no change in the growth outlook at all, purely because the future looks less predictable.
3. Treasury supply. Governments issuing more long-dated debt increase supply, and price falls when supply rises. Heavier issuance pushes long yields up mechanically, regardless of what the Fed does.
Nothing in the July 29 move requires an economic forecast to explain. Points two and three do most of the work.
Why It Hits Stocks, and Which Ones
This is the part that connects a bond market shape to a 2.19% Dow decline on a day the Fed changed nothing.
Long yields are the discount rate on future earnings. A share is a claim on cash flows arriving over years. To value it you discount those cash flows back to today, and the long bond yield is the base of that discount rate. When it rises, every future dollar is worth less now. Nothing about the company changed. The arithmetic used to value it did.
The effect scales with duration. The further out a company's cash flows sit, the more damage a higher discount rate does.
- A company whose value depends on 2030 earnings gets hit hardest. That is long-duration growth: unprofitable tech, high-multiple software, AI infrastructure, biotech.
- A company earning cash today at a stable margin barely notices. That is energy, consumer staples, tobacco, utilities with pricing power.
Look at July 29's dispersion against that framework. Technology fell 2.36%. Industrials fell 3.42%. Energy and consumer defensives were among the only groups higher. That is not sentiment, it is duration being repriced, sector by sector.
And it explains the odd juxtaposition of that night. Microsoft disclosed $678 billion of contracted backlog and rose about 8% after hours. That backlog converts over a weighted average duration of roughly 2.5 years, which is exactly the kind of asset a rising long rate marks down. Great news about the company, arriving into a market repricing the denominator. We unpacked that tension in can Microsoft save tech stocks? and the metric itself in what RPO is.
The Other Places It Shows Up
Beyond equities, three transmission channels worth knowing.
Mortgages. US 30-year mortgage rates track the long end, not the Fed funds rate. A bear steepener raises mortgage costs even while the Fed is on hold, which is why a hold can still tighten housing. It is also why Sherwin-Williams can report weak residential demand in a year of no rate rises.
Banks. Conventionally a steeper curve helps banks, since they borrow short and lend long. The caveat is that a bear steepener also marks down the long-dated bonds already on their balance sheets, so the benefit is prospective and the loss is immediate.
Long bonds themselves. A 30-year at 5.19% looks like attractive income and carries brutal price risk. Every further 10bp costs you capital. Duration works in both directions, which is why a high yield is not the same thing as a safe asset.
The Playbook
- Watch the 30-year every morning, before the S&P. The bond market prices this faster and more honestly than equities do. If the long end keeps rising, rallies in growth stocks are borrowed.
- Measure your duration exposure across both books at once. Long-dated growth equity and long-dated bonds are the same bet on inflation cooling. Holding both is doubling one position, not diversifying.
- A steepener is not a recession signal. That is an inverted curve, the opposite shape. Do not confuse them. This is closer to an inflation-credibility signal.
- Do not fight it with earnings analysis. No quarterly beat fixes a discount rate. In this regime, macro outranks fundamentals for exactly the stocks with the longest duration.
- The number that resolves it is inflation. Core PCE is the Fed's preferred gauge, and our read on the next print is in the core PCE preview. Cool data lets term premium settle. Hot data does the reverse.
- The counter-case: a steepener driven by genuinely stronger growth is survivable and even healthy for equities, because earnings rise alongside the discount rate. If Q2 GDP comes in strong and inflation cools together, this shape becomes benign and the July selloff looks like an overreaction. That outcome is possible. It requires the inflation half to cooperate.
The One-Line Read
A bear steepener is long yields rising while short yields fall, and on July 29 that meant a 2-year at 4.236% and a 30-year at 5.193%, which together say the market expects a Fed that will not tighten and an inflation problem that therefore will not resolve: it drops stocks by raising the discount rate rather than by damaging earnings, it punishes the longest-duration companies hardest, and the only thing that reverses it is inflation data.
Next up:Fed decision, Tuesday →
More on $TLT
Updated Every Saturday
The Week Ahead
Every earnings date, Fed event and setup for the current trading week, on one page.
Refreshed Weekly
Earnings Calendar
Who reports next, when, and what consensus and the whisper expect.
The Week-Ahead Brief
Don’t miss next week’s setups. Get the Sunday brief.
Latest issue, Sep 7“Week ahead in the stock market...”
Every Sunday: next week’s earnings dates, Fed days and the trades worth watching, from the same desk that writes the week-ahead hub. Free, built for retail investors.