Is Nu Holdings (NU) a Buy? 49% Growth Was 67% in Dollars
Nu Holdings crossed $1 billion of quarterly profit and jumped 9.33% to $15.23. The headline 49% growth is FX-neutral: in dollars it was 66.6%, and the 90-day bucket got worse.
TL;DR
- Yes, and the reason is the multiple rather than the milestone. NU closed Friday at $15.23, up 9.33%, at about 17.3 times annualised Q2 earnings for a business earning a 33% return on equity.
- Net income was $1,061.1 million, the first billion-dollar quarter in Nu's history, on managerial revenue of $5,875.7 million and 138.9 million customers.
- The growth rates in every headline are FX-neutral. Nu's own release says so in a footnote. In the dollars it actually reported, net income rose 66.6% year over year against the 49% quoted everywhere, and revenue rose 55.8% against 39%.
- The whole beat sits in one line. Risk-adjusted net interest margin went from 9.5% to 12.4%, and on Nu's own decomposition 115 basis points of that came from cost of credit falling rather than from earning more.
- The 90+ day NPL ratio rose to 6.9% while the 15-90 day ratio improved to 4.8%. The street's average target of $16.54 is now 8.6% above the price, so Friday consumed most of the published upside in one session.
More on $NU: Nu Holdings Earnings Preview (August 13): The One Name This Week Where The Whisper Sits Below Consensus →
Is Nu Holdings a Buy After the $1 Billion Quarter?
Yes, at $15.23, on a two-to-three quarter view. A business compounding at a 33% return on equity trading near 17.3 times the earnings it just produced is the kind of gap that usually needs something broken to explain it, and what is broken here is smaller than the discount.
I want to be exact about what I am buying, because the milestone and the merits are different things. Crossing $1 billion of quarterly net income is a nice sentence and it changes nothing about the business that was not true at $871 million in Q1. What changed is that the credit line everyone was worried about reversed hard, and the market repriced the stock 9.33% in a session for it. The preview I wrote a week earlier argued the opposite and lost all three of its logged rows, which is a decent reason to check my own reasoning twice here.
The Board
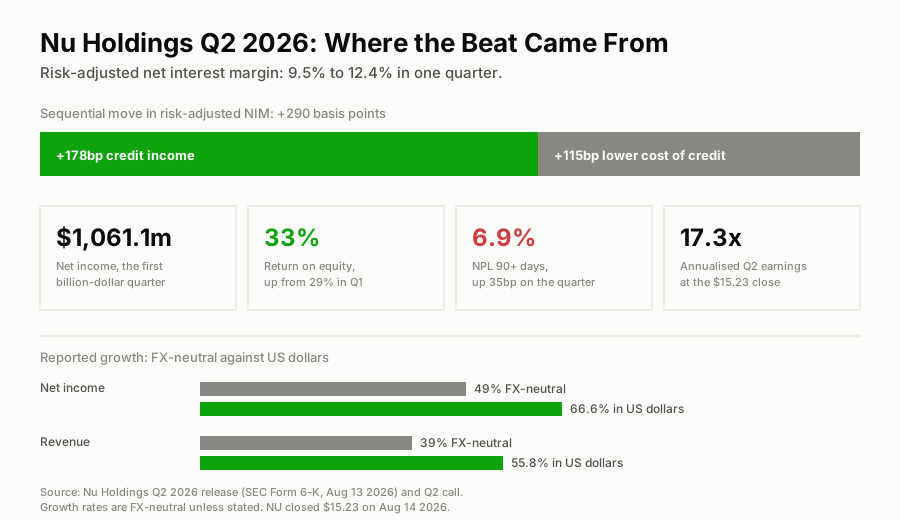
The beat, the currency, and the one ratio that went the wrong way.
The 290 Basis Points, Split Two Ways
Risk-adjusted net interest margin is the number this quarter lives on. It went from 9.5% to 12.4%, a record, after falling 100bp the quarter before.
Nu broke the move down on its call. 178 basis points came from credit income and 115 came from a lower cost of credit. Those sum to 293 against a headline move of 290, which is the rounding in a ratio published to one decimal place, so the attribution reconciles. That split is the part worth slowing down on. Credit income growing is the business working. Cost of credit falling is provisioning, and provisioning swings.
Cost of credit fell 9% quarter over quarter to $1.7 billion. Some of that is Brazil's Desenrola renegotiation programme, which management put at roughly 5% of cost of credit and about one third of the upside against internal expectations. The rest they attributed to the book performing.
Management then declined to call 12.4% a floor. They said they expect the margin to hold around that level and specifically would not commit to it as a base. I take that seriously. My working assumption is that Q3 prints a risk-adjusted NIM lower than this one, and the position has to survive that.
The Growth Rates Are in the Wrong Currency
Nu reports its dollar amounts in dollars and its growth rates on an FX-neutral basis, stated in a footnote to the Q2 release filed with the SEC. Most coverage of the quarter carried the growth rates without the footnote.
So "up 49%" and "up 39%" are real numbers describing a Brazilian business in Brazilian terms. A US investor holding an NYSE-listed ADR did better than that. Net income of $1,061.1 million against $637.0 million a year earlier is +66.6%. Revenue of $5,875.7 million against $3,772.3 million is +55.8%. Roughly seventeen points of each figure is the Brazilian real rather than Nubank.
That cuts both ways. A US holder has been paid twice, once by the operating business and once by a currency, and the second payment is not repeatable on demand. If the real gives back a chunk of the last year, reported dollar growth compresses toward the FX-neutral rate while nothing at all changes inside the company. Anyone underwriting 60%-plus dollar earnings growth into next year is underwriting an exchange rate.
The Bucket That Went the Wrong Way
Two credit ratios moved in opposite directions. The 15-90 day NPL ratio improved 16bp to 4.8%. The 90+ day ratio rose 35bp to 6.9%, and it is up year over year too, from 6.5%.
Nu's explanation is that these are one cohort seen at two points: first-quarter early delinquencies migrating through into the late bucket, with the improvement in the early bucket partly seasonal. That is coherent, and it means a record risk-adjusted margin and a worsening 90+ ratio can both be true this quarter without either being fake.
It also means the quarter settles nothing. The test is whether the 90+ ratio rolls back down in Q3 once that cohort has fully seasoned. If it does not, the margin line follows it, because provisions are where the two connect. That is the single number I would judge the next print on, ahead of net income, customers or revenue.
Credit expansion into higher-risk segments is deliberate here, so some of this is the plan working as designed. Nu is also not the only Latin American fintech where the growth optics and the unit economics have to be read separately: I had to do the same thing with dLocal's take rate against its payment volume.
What You Are Actually Paying
At $15.23 the market cap is $73.57 billion on about 4.83 billion shares. Annualise Q2's $1,061.1 million and you get $4.24 billion, so 17.3 times. Trailing twelve months puts it near 20.8 times; the forward figure is around 15.9 times.
For context on what that multiple buys: deposits of $45.3 billion, a credit portfolio of $39.4 billion growing 37% year over year, 138.9 million customers with an 83.5% monthly activity rate, ARPAC of $17.1 up 22%, and a 19.5% efficiency ratio against a company guide of about 20% for the full year. Mexico is at 15.8 million customers and $5.7 billion of deposits, Colombia at over 5 million and $3.3 billion.
The valuation is not screaming. The street average target is $16.54 with a range of $10 to $22, and Needham raised its target to $19 after the print. Friday's move took the stock through most of the average, so the easy repricing is behind it. What is left is a compounding argument: hold a 33% ROE at 17 times and let the earnings do the work, on the condition that credit behaves.
Below $13.93, Thursday's pre-print close, the margin reversal and the currency come for free. Above the 52-week high of $18.98, roughly 25% up from here, the multiple is doing the lifting instead of the earnings, and I would want the 90-day bucket resolved before paying that.
The Options Angle
I could not source a live chain on a Saturday, so nothing here is priced off a quoted premium and I am not going to imply otherwise. The structural point stands without one: this is a $15 stock, so a single options contract controls about $1,500 of notional, and the strike ladder is coarse enough that expressing a 15% view costs a large fraction of the move you are trying to capture. Buying premium the session after a 9.33% gap also means paying for elevated implied volatility to capture a move that already printed.
The call I want is the shares.
Trade log
| # | Stance | Structure | Strikes and expiry | Cost or credit | Spot at writing | Implied move | Conviction | Breakeven |
|---|---|---|---|---|---|---|---|---|
| 1 | Bullish | Long common stock | No expiry; scored on the Q3 2026 reaction session | n/a | $15.23, Aug 14 close | n/a | 6/10 | $15.23 |
| 2 | Pass | Long calls into the gap | No live chain sourced | n/a | $15.23, Aug 14 close | not sourced | 4/10 | n/a |
Both rows are on the Track Record ledger with the SPY close of $776.34 recorded against them, so the call gets scored against the index rather than in isolation.
The One-Line Read
Nu earned its billion-dollar quarter, but two fifths of the margin swing was provisioning and a quarter of the dollar growth was the real. At 17 times a 33% return, I will take that trade.
Next up:PCE inflation, tomorrow at 8:30am ET →
More on $NU
$NU · 2026-08-09
Nu Holdings Earnings Preview (August 13): The One Name This Week Where The Whisper Sits Below Consensus
$SPY · 2026-09-19
Stock Market Week Ahead (Sep 21-25): Costco, AutoZone, KB Home and a 5% Ten-Year
$SPY · 2026-08-28
Options Scorecard: The Week of August 17, Graded (25 Calls, 72% Right)
Updated Every Saturday
The Week Ahead
Every earnings date, Fed event and setup for the current trading week, on one page.
Refreshed Weekly
Earnings Calendar
Who reports next, when, and what consensus and the whisper expect.
The Week-Ahead Brief
Don’t miss next week’s setups. Get the Sunday brief.
Latest issue, Sep 27“Micron, PCE and the jobs report that decides October”
Every Sunday: next week’s earnings dates, Fed days and the trades worth watching, from the same desk that writes the week-ahead hub. Free, built for retail investors.