Why Is StubHub (STUB) Stock Down? Flat Sales, 79% More EBITDA
StubHub fell about 14% after hours despite GMS up 34% to $3.1 billion. The unchanged $400-420m EBITDA guide is why: it asks the second half for 71-87% profit growth on roughly flat sales.
TL;DR
- Q2 beat on every operating line. GMS of $3.1 billion, up 34%, revenue of $573.1 million, up 33%, adjusted EBITDA of $105.7 million, up 94%. The stock closed the regular session up 4.27% at $8.54, then fell about 14% in after-hours trade to roughly $7.35.
- The $0.00 per-share figure being quoted as a miss is a preferred-stock artefact. Consolidated net income was positive $14.6 million, against a $53.8 million loss a year earlier.
- Full-year GMS guidance went up, to $10.1-$10.3 billion from $9.9-$10.1 billion. The adjusted EBITDA guide did not move from $400-$420 million.
- Put those together and the second half has to produce $222-$242 million of adjusted EBITDA against $129.8 million last year, a 71-87% jump, while management guides GMS growth down to low single digits.
- Q2 gross margin ran at 82%, under the company's own mid-80s target, on World Cup fulfilment, customer support and legal costs.
More on Earnings: Stock Market Week Ahead (Sep 21-25): Costco, AutoZone, KB Home and a 5% Ten-Year →
Why Is StubHub Stock Down After Q2 Earnings?
Management guided second-half GMS growth to the low single digits, after a first half that grew about 21%. Everything else in the release was good, and that one sentence was enough.
Worth separating the two top-line numbers, because the release leads with the bigger one. GMS is the gross value of tickets sold across the marketplace: $3.1 billion in the quarter. Revenue is StubHub's cut of it, $573.1 million, or a little over 19%. The 34% GMS growth is the number in the headlines. The 19% take is the number that pays the bills, and it has been stable.
The World Cup is what made the quarter and what breaks the comparison. The tournament's ticket sales largely cleared through the June quarter rather than spreading across the matches themselves, which is why Q2 came in at +34% and the back half is guided to roughly nothing. Q1, for reference, grew GMS 7%.
The Board
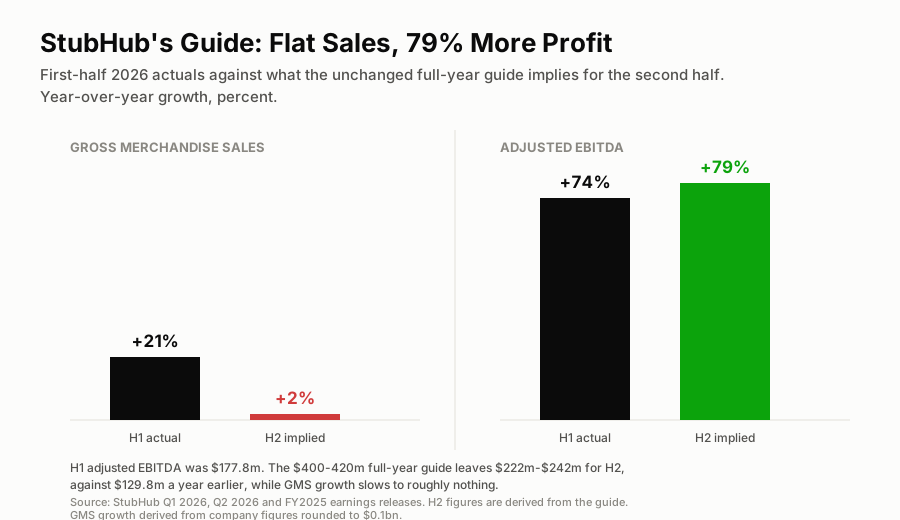
First-half actuals against what the unchanged full-year guide leaves for the second half.
The $0.00 Is Preferred Stock
A lot of coverage led with breakeven earnings per share against a consensus somewhere between $0.11 and $0.24, depending on whose survey you read. I would ignore that line.
Consolidated net income was $14.6 million, a swing from a $53.8 million loss in the year-ago quarter. Income attributable to common shareholders came to negative $40 thousand, because StubHub still has 490,000 redeemable preferred shares outstanding carrying an aggregate liquidation preference of $721.1 million. The preferred consumed the profit before it reached the common line. Divide $14.6 million by the 378.7 million diluted shares and you get about four cents; the preferred is the difference between that and zero.
Stock-based compensation also ran at $69.0 million in the quarter against $2.0 million a year earlier, which is post-IPO grants vesting on schedule rather than anything new. Neither item tells you much about how the marketplace traded.
What the Unchanged EBITDA Guide Asks For
Here is the part I think got underpriced in the reaction, in the opposite direction from the panic.
First-half adjusted EBITDA was $177.8 million ($72.1 million in Q1, $105.7 million in Q2). The full-year guide of $400-$420 million therefore leaves $222-$242 million for the second half. StubHub did $129.8 million in the second half of 2025. So the guide management left untouched implies 71% to 87% adjusted EBITDA growth over the next two quarters, on GMS the same guide says will barely grow.
On revenue of roughly 19% of GMS, that works out to an EBITDA margin near 24-25% in the back half, against 17.4% in the first half and 13% for all of 2025. Management's stated path is that the 82% gross margin was temporarily squeezed by World Cup costs and normalises from here, with efficiency gains on top.
Maybe. But the guide they raised was the one they had already beaten, and the guide they left alone is the one that now carries every bit of the difficulty. Raising GMS by $200 million while holding EBITDA flat is a company telling you the incremental volume arrives at low margin, or that it is keeping room for something. I read the low-single-digit GMS line as conservatism about a hard comp. The margin line I take more seriously as a risk.
The $1.7 Billion Cash Pile Is Mostly Other People's Money
Free cash flow was $309.7 million in the quarter, nearly three times adjusted EBITDA, and cash finished at $1.7 billion against $1.4 billion of debt. That looks like a company with net cash.
It is not, and StubHub says so: it reports 3.0x net leverage on trailing adjusted EBITDA, which by my arithmetic is around $308 million, implying roughly $0.9 billion of net debt. Most of that cash balance is money owed to ticket sellers who have not been paid yet, because a marketplace collects at the point of sale and settles after the event. Sell a stadium's worth of World Cup tickets in June and the cash lands long before the payout does. That flatters second-quarter cash flow and reverses out.
Where I Come Out
At roughly $7.35 in after-hours trade the stock is about 69% below its $23.50 September 2025 IPO price, which puts it in the same bucket as other 2025-26 listings that broke and stayed broken, SpaceX's post-lockup slide among them. On 378.7 million diluted shares that is roughly $2.8 billion of market value, before the $721 million of preferred sitting ahead of the common.
Against a $400-420 million EBITDA guide that is not an expensive stock. It is a stock whose entire 2026 rests on a second-half margin expansion the company has yet to demonstrate, in quarters where the top line goes sideways. I would want to see one clean quarter of that margin before paying up, which means Q3 in November is the print that matters, not this one. Anyone buying this on the 34% GMS headline has bought the easiest quarter of the year.
I could not source a live options chain at the time of writing and I am not logging a play against an after-hours quote on a sub-$10 name, where the spread is a meaningful fraction of the premium. No trade log this time.
Applied Materials reports after Thursday's close and PPI lands at 8:30am; the hour-by-hour timetable is here, and the rest of the week's reporters are on the earnings calendar.
The One-Line Read
The quarter was fine and the GMS guide went up. StubHub's problem is the profit guide that stayed still, which now needs the second half to grow EBITDA 71-87% on sales that go nowhere.
Next up:PCE inflation, Wednesday at 8:30am ET →
More on Earnings
Updated Every Saturday
The Week Ahead
Every earnings date, Fed event and setup for the current trading week, on one page.
Refreshed Weekly
Earnings Calendar
Who reports next, when, and what consensus and the whisper expect.
The Week-Ahead Brief
Don’t miss next week’s setups. Get the Sunday brief.
Latest issue, Sep 20“The week after the hike: two housing reads and Costco earnings...”
Every Sunday: next week’s earnings dates, Fed days and the trades worth watching, from the same desk that writes the week-ahead hub. Free, built for retail investors.