Broadcom Earnings Sept 2: The $16B AI Number Again
Broadcom (AVGO) reports fiscal Q3 2026 after the close on September 2. Guidance calls for $29.4 billion revenue and $16 billion of AI chip sales, up over 200%. The same guide got sold once in July.
TL;DR
- Reported: $29.6bn of revenue (up 86%) and $16.7bn of AI semiconductor revenue (up 221%), both above the guided $29.4bn and $16.0bn. Non-GAAP EPS was $3.32 against a $3.22-$3.24 consensus. The stock still fell, closing $367.24 in the regular session then trading near $354 in after-hours, down about 3.6% as of 5:00pm ET.
- Broadcom reports fiscal Q3 2026 after the close on Wednesday, September 2, with the call at 2:00pm PT / 5:00pm ET, per the company's Q2 release, which set the date.
- Management's own guide: $29.4 billion consolidated revenue, up 84% year over year, and $16.0 billion of AI semiconductor revenue, up more than 200%. Both figures come from the company, not an estimate.
- This is the same $16 billion number that got sold in July. Broadcom guided AI semiconductor revenue to $16 billion for the July quarter, delivered $10.8 billion actual and a fresh $16 billion guide for the number now due, and the stock fell 3% on the guide alone despite the AI business roughly tripling year over year.
- AVGO closed $380.00 on August 18, down 3.17% that session and 23.2% below its $495.00 52-week high, part of a broader chip-and-rates selloff, not something specific to Broadcom.
- Consensus non-GAAP EPS sits near $3.22 to $3.24, up from $2.44 last quarter, tracking the guided revenue jump. Full detail and the trade log below.
UPDATE (August 26, 2026): the stock has fallen further, and a competitive threat joined the financing story. AVGO traded near $357 early Wednesday morning, per stockanalysis.com, down from the $380.00 close this piece opened with, on top of the 23% pullback from the 52-week high already described below. The new pressure: Marvell landed a custom AI chip deal with Google, reported August 19, which threatens Broadcom's position as Google's primary custom-silicon partner rather than an exclusive one. That sits alongside the financing-risk story already in this piece, not instead of it. September 2 now has to answer two separate questions the market has raised since this preview was first filed: is the $16 billion AI guide real, and is Broadcom's position with its largest custom-chip customer still exclusive.
More on $AVGO: Why Is Broadcom Stock Down? The $370B Number Isn't a Loss →
The Board
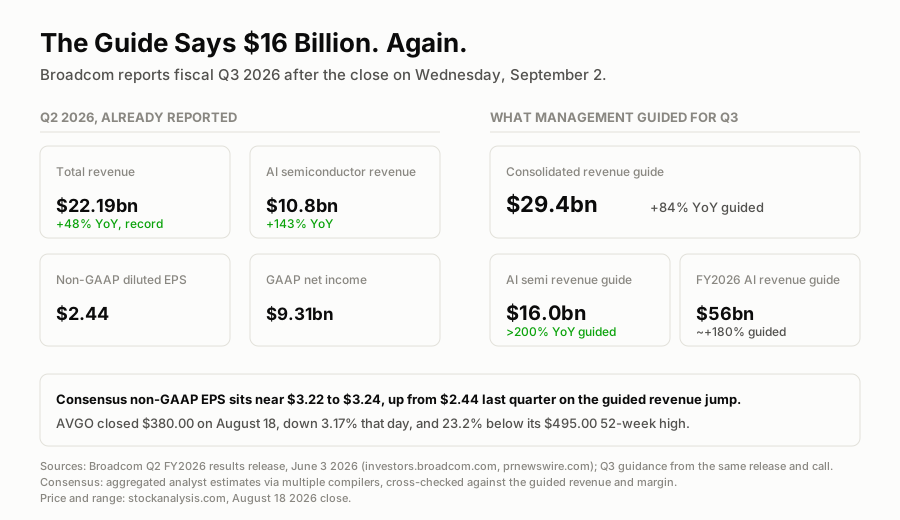
Same guide number as July. Different question: does the market treat a tripling business differently the second time.
When Does Broadcom Report Q3 Fiscal 2026 Earnings?
After the market closes on Wednesday, September 2, 2026, with results out around 4:05pm ET and the call at 5:00pm ET. That timing is confirmed on Broadcom's own investor relations site and cross-checked against wire coverage of the announcement. September 2 sits 14 days out from today, which is enough lead time to be worth writing up now rather than the morning of. The rest of that week, including the August jobs report two days later, is on the week-ahead hub.
What Q2 Actually Delivered
Broadcom's fiscal Q2 2026, reported June 3, was a record quarter by a wide margin. Total revenue hit $22.19 billion, up 48% year over year. AI semiconductor revenue, the number the whole AI-infrastructure trade watches, came in at $10.8 billion, up 143%, ahead of what management had guided three months earlier. Non-GAAP diluted EPS was $2.44 on non-GAAP net income of $12.07 billion; GAAP net income was $9.31 billion, GAAP diluted EPS $1.91. Free cash flow ran $10.26 billion, 46% of revenue, which is the kind of margin structure that makes the AI-chip story different from most of the rest of the sector.
None of that is in dispute. The more interesting number is the guide Broadcom issued for the quarter now coming due: it's the same $16 billion figure, in dollar terms, that already produced a selloff once this year.
The Same $16 Billion Number, Twice
In mid-July, Broadcom guided its (then-upcoming) quarter's AI semiconductor revenue to $16 billion, up more than 200% year over year. The stock fell 3% on that guide and dragged the rest of the AI-chip complex down with it, because the Street's whisper number had drifted above what even a business tripling could print. Now, for fiscal Q3, Broadcom has guided AI semiconductor revenue to $16.0 billion again, this time against a higher base and framed as "over 200%" growth rather than exactly 200%.
I want to be precise about what changed and what didn't. The dollar figure repeating isn't a coincidence or a company running in place: AI semiconductor revenue was $10.8 billion in the quarter that guide applied to, and $16 billion is the number for the quarter after that, so the guide itself represents continued sequential growth. What's actually being tested a second time is the market's relationship to that number. Does a name that already got sold on a printed-in-writing tripling get the same treatment again, or does the second instance of "great number, weak reaction" convince the market the great number was real the first time.
Checking the Arithmetic
Run the reconciliation before trusting any of this. Q3 guide of $29.4 billion against the $15.95 billion Broadcom reported in the year-ago quarter works out to +84.3%, matching management's own "84%" language almost exactly. AI semiconductor guide of $16.0 billion against an implied year-ago AI base near $5.3 billion (back-calculated from the full-year AI guide and the growth rate management has cited) comes out just over +200%, again consistent with what was said on the call. Both figures pass the internal-consistency check, which matters more here than usual. This is a guide, and a guide that doesn't multiply out cleanly is a guide I wouldn't trust.
There's no separate published guidance range for non-GAAP EPS; Broadcom guides revenue, AI revenue and operating margin (non-GAAP operating margin guided stable near 67%), and the Street backs into an EPS number from there. Consensus I found clustered at $3.22 to $3.24, sitting right inside what the guided revenue and margin imply, rather than stretching above or below it. That's the one place this preview differs from PDD's, published the same day on this site: Broadcom management puts specific numbers in writing, and this quarter's Street estimate sits right where those numbers say it should.
The Debt Question Sitting Underneath the Print
Broadcom's stock has had a second, unrelated headwind this month. A Bank of America note put a $370 billion peak notional figure on Broadcom's AI chip-financing vehicle by 2029, and the stock fell 5.92% on that report even though the figure Broadcom has actually filed for its first tranche's maximum exposure is $29 billion, not $370 billion. That's a separate story from the earnings print, a credit-structure concern rather than a demand concern, but it's part of why AVGO is sitting 23% off its high heading into a quarter where the operating numbers, on their own, look fine. A reader trying to size a position into September 2 should keep those two threads apart: one is "is AI chip demand still tripling," which the numbers say yes to, and the other is "how much financing risk sits behind the customers buying those chips," which is a real question this preview isn't trying to resolve.
The Options Angle
I couldn't source a live option chain for the September 2 print in this session, so no straddle price gets invented here. Broadcom's historical earnings-day moves have run in a wide band, roughly 6% to 9% across recent quarters per the aggregator data I could pull, and the July guide-day reaction (a 3% move on a guide that beat) is itself a data point: this name moves on the gap between print and whisper, more than on the raw growth rate printed.
Given a guide that already reconciles cleanly and a stock already down 23% from its high on an unrelated financing story, my lean is toward a structure that profits from continuation of the AI-chip growth story without needing a violent single-day move, rather than a pure directional earnings bet.
Trade log
| # | Stance | Structure | Strikes and expiry | Cost or credit | Spot at writing | Implied move | Conviction | Breakeven |
|---|---|---|---|---|---|---|---|---|
| 1 | Pass | Long straddle | $380 weekly, expiring Sep 4 | no live chain sourced | $380.00 (Aug 18 close) | ~6-9% historical range | 4/10 | needs >6-9% either way |
| 2 | Pass, bullish lean | Long call, 60 days out | $400C, Oct 16 expiry | no live chain sourced | $380.00 (Aug 18 close) | ~6-9% historical range | 6/10 | ~$400 plus premium, unpriced |
Both rows are passes: I don't have a live chain to price either one, and section 8 of this site's house rules is explicit that a structure with no sourced premium doesn't get logged as an entered play. The earnings-week straddle is a pass because a guide that already checks out on paper and a stock already repriced lower on a separate story isn't the setup where I want to pay a full volatility premium for a coin-flip direction. The slower call is the one I'd actually size up once a real premium is in hand: a bet that a second consecutive "over 200%" AI guide eventually stops getting sold and starts getting bought, once the financing-risk story either resolves or gets priced in on its own.
Grading note, added September 2, 2026, 7:15pm ET: the print landed after the close and AVGO's after-hours move already narrowed from roughly -6% to roughly -3.6% within the first hour, before settling near $354. Both rows above stay
Pass, statusopen, with tonight's after-hours quote logged as a mark rather than a grade: this site's own house rule is to score against the settled close, not the first extended-hours tick, after a July SMCI pass was marked a win on an early after-hours read and had to be reversed once the stock settled +32.4%. If Thursday's close lands inside the roughly 6-9% historical earnings-day range this piece cited, the straddle pass reads as correct; the bullish-lean call grades separately against where the stock actually settles. Both get marked in the next scorecard.
The One-Line Read
Broadcom is guiding the same $16 billion AI number that got sold once already, on top of a stock that's fallen for a completely separate reason, and September 2 is the session that tells you whether the market has started pricing the tripling business correctly or is still trading against a number nobody printed.
Related reading: how the July $16 billion guide actually traded is in the sell-the-news breakdown, and the debt-structure concern behind the August selloff is unpacked in the $370 billion backstop piece. For how the AI-chip demand story connects to memory pricing, see the memory complex update. Nvidia's own August 26 print, the other half of the AI-capex read-through, is covered in the NVDA earnings preview. Every logged call here is tracked at the Track Record ledger.
Next up:ISM Services PMI, Monday at 10:00am ET →
More on $AVGO
Updated Every Saturday
The Week Ahead
Every earnings date, Fed event and setup for the current trading week, on one page.
Refreshed Weekly
Earnings Calendar
Who reports next, when, and what consensus and the whisper expect.
The Week-Ahead Brief
Don’t miss next week’s setups. Get the Sunday brief.
Latest issue, Sep 27“Micron, PCE and the jobs report that decides October”
Every Sunday: next week’s earnings dates, Fed days and the trades worth watching, from the same desk that writes the week-ahead hub. Free, built for retail investors.