Is Target (TGT) a Buy Before August 19? The Street's Average Is $15 Below the Price
Target closed at $159.00 on August 19, up 4.28% at a 52-week high and 11.4% above the sell-side's $140.90 average target. The pass at $155.51 is marked as a loss.
UPDATE (August 19): the print is in. Q2 EPS of $4.11 carried $1.65 of tariff refunds; the operating number is about $2.46, up 20%, with comps up 3.8% on traffic up 3.6%. The full-year guide moved to $9.90-10.90 including the refunds, roughly $8.25-9.25 ex-refund, through the old $8.50 ceiling. A good quarter, and the stock still slipped about 1.6% premarket to $149.99 per Investing.com, from a $152.48 Tuesday close: with consensus already parked on the guide ceiling and the tape at a 52-week high, even a raise bought little. Both rows below get scored on tonight's close. Full results are in the preview.
UPDATE (August 19, 4:15pm ET): the verdict was wrong and the stock closed at a 52-week high. Target finished at $159.00, up 4.28%, having first sold off to $146.21 and then run to $161.98. It spent about half an hour inside the low $140s entry I said I wanted, and then went the other way for the rest of the day. The call below was a pass at $155.51; the stock is $3.49 above that, so the pass is a loss and it is marked as one. What I got right was the shape of the reaction rather than its direction: a raise that only reaches consensus buys little, and Target's raise went well past consensus, which is why the tape paid for it. The sell-side panel now has a different problem, with the average target of $140.90 sitting 11.4% below the close.
TL;DR
- Target reports fiscal Q2 on Wednesday, August 19, before the open. It closed August 13 at $155.51, up 0.98%, after printing a 52-week high of $156.47 during the session.
- The stock has run past the entire sell-side panel. The average 12-month target is $140.90 across 38 analysts polled by S&P Global, 9.4% below the close. Other aggregators put the average between $127 and $134. Not one of them is above the price.
- The consensus rating is Hold: 12 buys, 23 holds, 3 sells.
- Options price a 6.5-6.9% move on the print. A full move to the downside lands the stock near $144.80, which is still above the average target.
- My verdict: not a buy at $155.51. The turnaround is real. The entry is bad. Low $140s is where I want it.
More on $TGT: Target Earnings August 19: The Turnaround Trade Meets a 52-Week High →
The Board
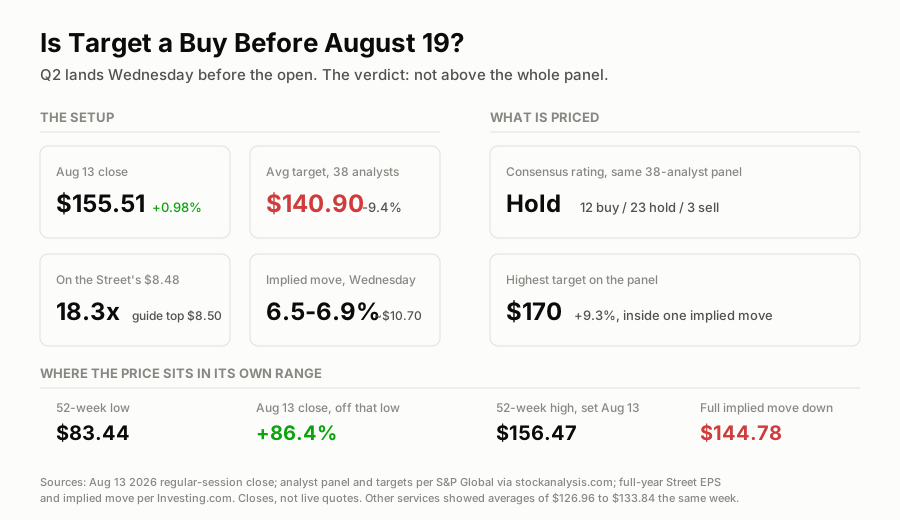
The price is above the average target and above the rating. Both at once.
Is Target Stock a Buy Before the August 19 Print?
No, not at $155.51. The stock closed August 13 at a 52-week high and above every average analyst target I could source, which is an unusual place to be buying a retailer four days before it reports.
My problem is with the entry. The preview walks through why Q1 earned this rally: comps up 5.6% on traffic up 4.4%, the first positive comp after four negative quarters, from Target's own release. That was a good quarter and the stock has since been paid for it.
The Panel Ran Out of Room
At $155.51 the stock sits 10.4% above the $140.90 average target. Divide the other way and the target sits 9.4% below the stock. Same gap, two bases, and I would rather print both than let a reader compare my percentage against someone else's denominator.
The dispersion is the more useful part. On that 38-analyst panel the low target is $92 and the high is $170. So the most bullish analyst covering Target sees 9.3% of upside, which is less than the options market's own error bar for a single Wednesday. There is no one left on the street forecasting a materially higher price.
Treat the averages themselves with some care. The $140.90 figure comes from S&P Global's panel via stockanalysis.com. Other services showed $126.96, $133.70 and $133.84 the same week, and I could not tie the difference back to a single analyst set, so I am quoting the range instead of picking one. All four are below the close.
What the Print Has to Do
Beating the quarter is not enough, and Target has beaten four in a row.
The number that decides Wednesday is the full year. Management guided adjusted EPS to $7.50-8.50 in May and said results were tracking near the high end. The Street's full-year figure has since climbed to about $8.48, two cents under the top of that range. An in-line quarter with an affirmed guide therefore delivers nothing the price does not already carry; the range itself has to move. Walmart walks into the identical trap on Thursday, with its consensus parked on its own ceiling too.
I will read traffic before the EPS line, because a 5.6% comp followed by a 1% comp is a promotion that worked once rather than a turnaround. I will also check whether tariff refunds are sitting inside the number. Target excluded them from guidance in May, and refunds have flattered several headline prints this season.
Where I'd Buy It
Low $140s.
That range comes from two numbers that happen to agree. A full 6.9% implied move to the downside puts the stock at $144.78, and the sell-side average sits at $140.90. One disappointing Wednesday would therefore deliver roughly the price the analyst panel already calls fair. I would rather own a traffic-led turnaround there than at 18.3 times the Street's $8.48 with a Hold consensus and a fresh 52-week high in the tape.
If the guide goes to a $9 handle with traffic holding, I miss it and the bulls were right. That is a fine way to be wrong. Paying the highest price anyone has paid for this stock in a year, four days before the event that has to justify it, is not.
The Options Angle
Options are pricing 6.5-6.9%, roughly a $10.70 swing on $155.51. Against Target's record of double-digit earnings gaps that looks fairly struck to me, so I would not go hunting for a volatility mispricing here.
The skew is where I think the value is. With consensus parked on the guide ceiling and the stock trading through every average target, the left tail is long and the right one is short. A straddle buys both wings at full price, and I only want one of them.
No live options chain was available to me for this piece, so the row below is quoted against the implied move. The preview already logs a September put and a straddle pass on this name. This is the same view in a defined-risk structure, and the scorecard should grade the three rows as one call.
Trade log
| # | Stance | Structure | Strikes and expiry | Cost or credit | Spot at writing | Implied move | Breakeven |
|---|---|---|---|---|---|---|---|
| 1 | Bearish | Long put spread | ~$150P / ~$140P, Aug 21 weekly | no live chain sourced; quoted against the ±6.5-6.9% implied move, max value $10 wide | $155.51 close, Aug 13 | ±6.5-6.9% | TGT below $150 minus the debit |
| 2 | Pass | Long stock at the close | n/a | n/a | $155.51 close, Aug 13 | ±6.5-6.9% | scored against $155.51 |
Row 2 is the call this piece is actually making. If Target reports on Wednesday and runs, that pass is a loss and gets marked as one.
Marked at the August 19 close of $159.00. Row 1 is underwater: a $150/$140 put spread expiring Friday needs the stock back under $150, ten dollars below where it closed, in two sessions. Row 2 ran, so the pass costs 2.24% against buying at $155.51. Both are on the Track Record ledger as open marks until Friday's expiry settles the spread.
The One-Line Read
Target's turnaround is real and the stock has already been paid for it. At $155.51 the price is above every average target on the street and above its own rating. I want it in the low $140s.
Next up:PCE inflation, Wednesday at 8:30am ET →
More on $TGT
Updated Every Saturday
The Week Ahead
Every earnings date, Fed event and setup for the current trading week, on one page.
Refreshed Weekly
Earnings Calendar
Who reports next, when, and what consensus and the whisper expect.
The Week-Ahead Brief
Don’t miss next week’s setups. Get the Sunday brief.
Latest issue, Sep 27“Micron, PCE and the jobs report that decides October”
Every Sunday: next week’s earnings dates, Fed days and the trades worth watching, from the same desk that writes the week-ahead hub. Free, built for retail investors.