monday.com Earnings Preview (August 10): Guided To Slow Down, Priced For Something Worse
monday.com reports Q2 2026 on Monday August 10 before the open. Consensus wants $355.5m of revenue and $1.11 of EPS, and options price a 23.4% move on a stock down from $264 to $93.
TL;DR
- Updated August 10, at the close: the print is in, and it beat everything except the part that mattered. Revenue came in at $364.6 million, up 22%, past the $354-356 million guide and the $355.5 million consensus. Non-GAAP operating income was $61.1 million (17% margin) against a $46-48 million guide, and non-GAAP EPS was $1.48 against $1.11. Then management left the full-year revenue range exactly where it was and guided Q3 to $368-370 million, below the roughly $372.9 million consensus. The stock closed at $88.62, down 4.84% from Friday's $93.13, clawing back most of the 9.05% pre-market decline this piece first quoted. The trade log below is scored against today's close.
- This preview missed the layoffs, and they explain the margin. On July 22 monday.com announced a restructuring cutting about 20% of its workforce, roughly 600-630 roles. That is where most of the raised profit guidance comes from, and it belonged in the original piece. Full accounting below.
- monday.com reports Q2 2026 on Monday, August 10, before the US open, opening the busiest earnings week left in the quarter.
- Consensus wants revenue of $355.5 million and adjusted EPS of $1.11 from 24 analysts, with the EPS spread running $0.98 to $1.26. Company guidance is $354-356 million, so consensus sits at the top of the range management gave itself.
- The guided number is 18-19% growth, down from the 24% the company printed in Q1 on $351.3 million. On the sequential line that is roughly 1% growth quarter on quarter.
- Options price a 23.4% move over the print, the widest single-name implied move on this week's calendar. On a stock that has been as high as $264 and as low as $57.50 in twelve months and closed Friday at $93.13, that is the market saying it has no idea.
- The February call is why. Management described weakness in the low-touch, self-serve channel that sells to small businesses as structural rather than temporary, and the shares fell about 17% on the outlook. Monday is the first real test of whether that read was too harsh.
More on Earnings: Stock Market Week Ahead (Sep 21-25): Costco, AutoZone, KB Home and a 5% Ten-Year →
When Does monday.com Report Earnings?
Monday, August 10, before the US market opens. The rest of the week, including CoreWeave and Super Micro on Tuesday and July CPI on Wednesday, is laid out in the earnings calendar and in our week-ahead hub.
The Board
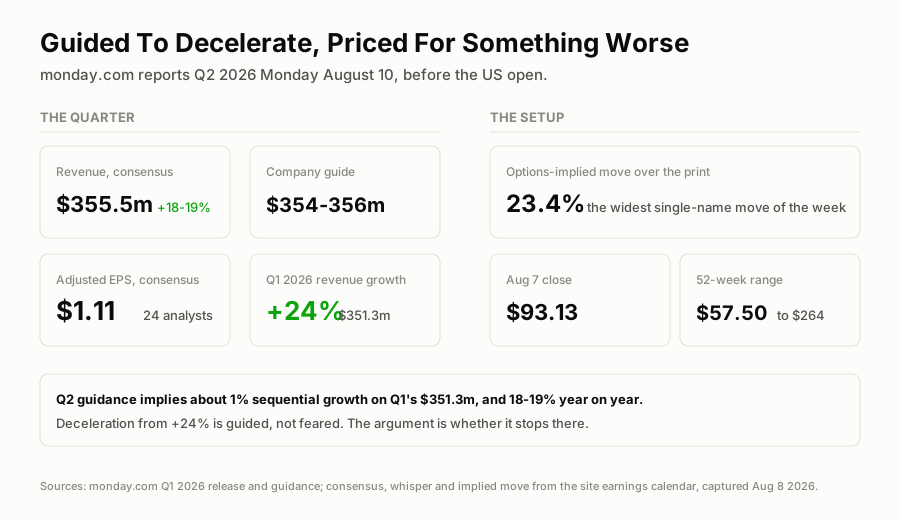
Consensus sits at the top of a guide the company set low. The option market is not trading the guide at all.
What Landed (August 10)
Every line of the quarter beat. Here is the scorecard against what this piece said to watch.
| Q2 2026 | Guide / consensus | Actual |
|---|---|---|
| Revenue | $354-356m guide; $355.5m consensus | $364.6m, up 22% |
| Non-GAAP operating income | $46-48m (13-14% margin) | $61.1m (17%) |
| Non-GAAP diluted EPS | $1.11 consensus | $1.48 |
| Adjusted free cash flow | n/a | $52.3m (Q1: $102.8m) |
| Net dollar retention | 110% in Q1 | 109% |
| Customers above $100k ARR | 1,844 in Q1, up 39% | 2,019, up 37% |
Revenue of $364.6 million is 3.8% sequential growth on Q1's $351.3 million. The guide implied about 1%. So the plateau this piece described did not arrive on schedule, and I was too quick to treat the sequential arithmetic as destiny.
The GAAP line looks alarming and is not. A $1.5 million GAAP operating loss sits under that $61.1 million of non-GAAP operating income because of $41.2 million of share-based compensation and a $21.4 million restructuring charge. Those three numbers reconcile to the dollar. Share-based comp actually fell from $56.6 million a year ago.
The Guide That Did Not Move
This is the sentence the preview ended on: the number that decides Monday is whether the full-year guide moves. It did not.
Full-year revenue guidance is $1,466-1,474 million, up 19-20%, identical to the range given in May, to the digit.
Work through what that means, because it is the whole reaction. First half revenue came in at $715.9 million. Against the $1,470 million midpoint, that leaves $754.1 million for the second half. Under the May path, with Q2 landing at its $355 million guide midpoint, the second half would have carried $763.7 million. The Q2 beat was $9.6 million, and implied second-half revenue fell by almost exactly that. The beat was absorbed, not passed through.
Q3 is where it shows. Guidance of $368-370 million is 16-17% growth, against a consensus near $372.9 million. The midpoint is 1.2% sequential growth on the quarter just reported. That is the plateau, now in management's own numbers rather than in my arithmetic.
The Layoffs This Preview Should Have Mentioned
On July 22, 2026, more than two weeks before this piece went out, monday.com filed a restructuring plan cutting about 20% of its workforce, reported at roughly 600-630 roles, around 350 of them in Tel Aviv. Estimated net charges are $45-55 million, with the majority landing in the second half. The company framed it as aligning around an "AI Work Platform" and said plainly that improving margins was not the purpose.
Omitting that was a real gap, and it distorted the setup I described. Here is the corrected version of the margin story:
- May guide: non-GAAP operating income $185-191 million, about a 13% margin.
- July 22, with the restructuring: margin guidance lifted to about 15%.
- August 10: $230-234 million, about 16%.
So the full-year profit guide is up roughly $44 million since May, but most of that step was already public on July 22. Today added a point of margin, not four. Anyone reading the raise as a fresh surprise is double-counting the layoffs.
Two things did not move at all: full-year revenue growth of 19-20%, and adjusted free cash flow of $280-290 million. Cutting a fifth of the staff has changed the cost base and not, so far, the growth rate.
The Channel, Revisited
The preview said two lines would settle the argument: large-customer net adds, and the full-year guide. Both reported, and they point in opposite directions.
The enterprise cohort is still compounding. Customers above $100,000 of ARR reached 2,019, up 37%, and those above $50,000 reached 4,834, up 31%. AI products doubled their ARR from Q1 and made up 17% of net new ARR. That is a real business and it is growing faster than the company.
Net dollar retention slipped to 109% from 110% in Q1. One point is inside the noise and I would not build a thesis on it. What I would note is the shape: a company adding $100k+ customers at 37% while net retention sits at 109% is expanding its existing base slowly, whatever it is winning at the top end. The self-serve funnel is still the unanswered question, and today's release did not address it.
The Deceleration Is Guided, Not Feared
This is the part that gets misreported every quarter. monday.com is not being ambushed by a slowdown. It told the market about this one in May, alongside Q1 revenue of $351.3 million, up 24%, record GAAP operating income of $19.8 million (a 6% margin) and non-GAAP operating income of $49.0 million (14%).
Its own Q2 guide was $354-356 million, or 18-19% growth, and management attributed the step down to lapping prior pricing changes and to softness in small-business demand. The full-year guide is $1,466-1,474 million, up 19-20%.
Do the sequential arithmetic, because it is the uncomfortable version: $351.3 million to a $355 million midpoint is roughly 1% growth in three months. For a company the market once paid a triple-digit multiple for, a quarter of a percent a month is not a growth rate, it is a plateau. My read is that the guide was set to be beaten and the sequential optics were the price of setting it there. The number that decides Monday is not the beat, it is whether the full-year guide moves.
The Channel That Broke
The reason the stock is at $93.13 and not $264 traces to one disclosure. On the February 9 call, management said the weakness in the no-touch, performance-marketing-led channel that acquires small and mid-sized customers was not a passing demand dip, and that it did not expect those channels to exit a choppy environment during 2026. The shares fell roughly 17% on that outlook.
That is a different problem from a macro slowdown, and it is worth being precise about why. A no-touch funnel is the cheapest revenue a software company can buy: no salesperson, high margin, compounding. If that funnel structurally degrades, the fix is enterprise sales headcount, which is slower, more expensive and permanently dilutive to margin. The bull answer is that AI-assisted search is doing to the funnel what it is doing to everyone's funnel, and that the enterprise motion (record net additions of customers above $500,000 of ARR in Q1) is the real business anyway.
Both readings survive Monday unless one line moves: net adds in the large-customer cohort, and any change in the full-year revenue guide. Everything else is noise around a quarter that management has already described.
What The 23.4% Implied Move Is Actually Saying
An implied move of 23.4% on a $93 stock is about $22 a share of expected range, and it makes monday.com the most violently priced name of the week, ahead of Super Micro's roughly 18%. Options do not price direction, they price disagreement, and the disagreement here is total: one camp thinks a 19%-growth software company with 14% non-GAAP operating margins at a $57.50-264.00 twelve-month range is a washed-out compounder, the other thinks the funnel damage is permanent and the multiple has further to fall.
The house rule from July applies with force: "implied looks expensive" was badly calibrated in this earnings season, and realised moves repeatedly beat implied on names with exactly this profile. Our implied versus realised move database is the record of that. Selling a 23.4% straddle into a name that fell 17% on a guidance sentence is picking up nickels in front of a steamroller.
The Options Angle
The setup rewards defined risk and punishes premium selling.
- The straddle is expensive and roughly fairly priced, not a bargain. Buying it needs a move of about a quarter of the stock's value to pay, and the last three prints have delivered moves in that neighbourhood.
- The cleaner expression of the bull case is a call spread, which caps the cost of being early. The call I want is upside above the guide-raise level, financed by selling the strike the whisper implies.
- Selling covered calls into a 23.4% implied move on a stock 65% off its high is the trade that scored worst across July: it collects a small premium and caps the only outcome that repairs the position.
Trade log
| # | Stance | Structure | Strikes and expiry | Cost or credit | Spot at writing | Implied move | Breakeven |
|---|---|---|---|---|---|---|---|
| 1 | Bullish | Call spread | $100C / $115C, Aug 21 | Live prices not sourced; quoted against the implied move | $93.13, Aug 7 close | ±23.4% | Needs a close above $100, inside the implied range |
| 2 | Pass | Short straddle / premium sale | $95 straddle, Aug 21 | ~23.4% of spot collected | $93.13, Aug 7 close | ±23.4% | Loses beyond $71.34 or $114.92 |
| 3 | Pass | Covered call | Aug 21 upside strikes | Not sourced | $93.13, Aug 7 close | ±23.4% | Scored on the whole position, not the leg |
Row 1 is logged without a live debit because option prices for the August 21 expiry could not be sourced at writing; it is scored against the realised move and the $100 level. Rows 2 and 3 are passes and get scored as trades not taken.
Updated August 10, at the close of $88.62 (down 4.84% from Friday's $93.13, well off the 9.05% pre-market print this piece first quoted):
- Row 1, the call spread, is still losing but not as badly as this morning suggested. It needs a close above $100 by August 21, a further 12.9% from tonight's $88.62. The bull case required the guide to move, I said so explicitly, and the guide did not move. This one stays open into the August 21 expiry; the close pulled it back from the depths of the pre-market print, and there are eleven days left for it to matter.
- Row 2, the pass on selling the straddle, is a loss. The $95 straddle lost money only beyond $71.34 or $114.92. A 4.84% close lands nowhere near either wing, so the premium sale I talked readers out of would have paid. Final, per the house rule that a pass is scored the day of the print, not the option's own expiry.
- Row 3, the pass on covered calls, is also a loss. Selling upside into a 23.4% implied move, on a stock that then fell, would have beaten holding the shares outright. Final.
That is 0 for 2 final, 1 open, and the reasoning failed in a specific, useful way. I applied July's calibration lesson (realised moves kept beating implied, so do not sell volatility) to a name where implied was 23.4% and the close realised 4.84%. Option sellers were paid handsomely here. July's lesson was a description of one season, and I used it as a rule. The implied versus realised database gets this entry logged on the other side of the ledger.
Rows 2 and 3 are final as of tonight's close. Row 1 scores at the August 21 expiry.
The One-Line Read
monday.com has already told the market that growth steps down from 24% to 18-19% and that its cheapest acquisition channel is structurally impaired, so Monday is not about the beat: it is about whether the full-year guide moves and whether the enterprise cohort is big enough to carry a company the market has already marked down by two thirds.
Updated August 10. The guide did not move, and that turned out to be the answer. monday.com beat its own quarter by every measure available, cut a fifth of its staff to buy three points of margin, and still would not add a dollar to the full-year revenue range. A software company that responds to a beat by holding the top line and raising the profit line is telling you where it thinks growth goes next. The market quoted it down about 9% before the open and closed down 4.84%, less than a quarter of the move the options were charging for.
Next up:PCE inflation, Wed, Sep 30 at 8:30am ET →
More on Earnings
Updated Every Saturday
The Week Ahead
Every earnings date, Fed event and setup for the current trading week, on one page.
Refreshed Weekly
Earnings Calendar
Who reports next, when, and what consensus and the whisper expect.
The Week-Ahead Brief
Don’t miss next week’s setups. Get the Sunday brief.
Latest issue, Sep 20“The week after the hike: two housing reads and Costco earnings...”
Every Sunday: next week’s earnings dates, Fed days and the trades worth watching, from the same desk that writes the week-ahead hub. Free, built for retail investors.