Apple Options Before Earnings: $442 Million in Calls, a 4% Implied Move, and What It Actually Predicts
Apple options traders bought $442M of calls Friday and priced a 4% earnings move against a 1% historical average. What that flow means, and whether it predicts direction at all.
TL;DR
- Apple reports Thursday after the close, and Friday's options tape leaned hard bullish: $442 million of the $590 million in premium traded was tied to calls, with roughly 560,000 calls bought against 332,000 puts.
- The number that actually matters is different: options imply a ~4% post-earnings move against an average 1% swing over the past year. The market is pricing four times the usual reaction.
- There's a real reason for that, and it isn't in the flow data: this is Tim Cook's final earnings call as CEO. Transition risk is genuine event risk.
- Heavy call buying is a famously poor predictor of direction. The implied-versus-realized gap is a much better predictor of magnitude. Those are not the same trade.
More on $AAPL: Why Did Apple Stock Drop After Earnings? Services Missed, Then the September Guide Came In Light →
Does Heavy Call Buying Mean Apple Stock Will Go Up?
No, not reliably, and anyone telling you otherwise is selling something. A 1.7-to-1 call-to-put ratio looks bullish and feels bullish, but options volume does not tell you what you need to know. It doesn't say whether each contract was bought or sold, whether it was one leg of a spread, or whether it was a dealer hedging something else entirely. A "call buy" print can be a bullish speculator, a fund selling upside against stock it already owns, or a market maker offsetting risk.
Retail-heavy call skew has historically been a weak signal at best and a mildly contrarian one at worst. What the flow genuinely tells you is that positioning is crowded on one side, which matters for how the stock behaves after the print, not for which way it goes.
The Board
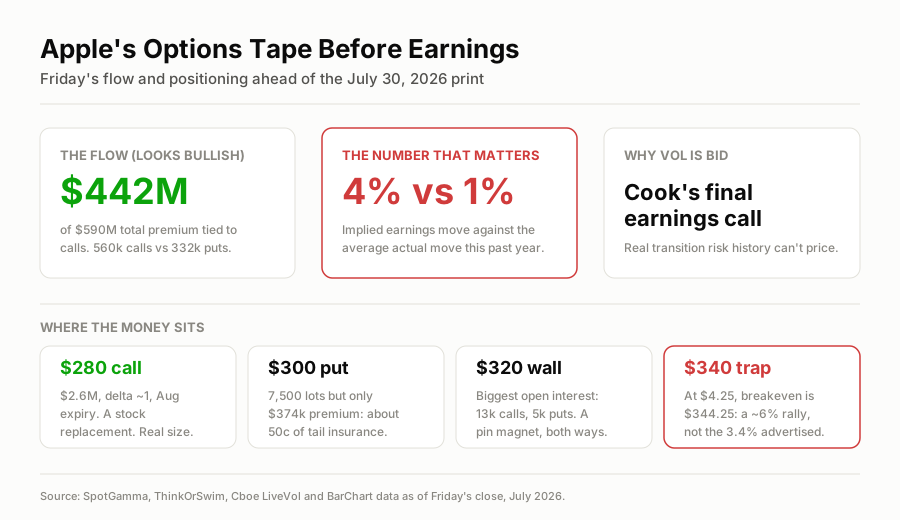
Bullish flow on the left, the number that actually matters in the middle, and the strikes where the money sits on the right.
The Only Number That Reliably Predicts Anything
Forget the call-put ratio for a second. Options are pricing a ~4% move. Apple's average post-earnings move over the past year has been about 1%.
That gap is the single most informative figure in the whole dataset, and here's why it matters. When you buy an option into earnings, you are not betting on direction alone, you are buying implied volatility that collapses the moment the news is out. Pay for a 4% move, get a 1% move, and you lose even when you picked the right direction. That's the mechanic that destroys most earnings-week option buyers.
Historically, across mega-cap earnings, implied moves overshoot realized moves more often than they undershoot. That's the volatility risk premium: option sellers get paid for absorbing uncertainty, and on average they collect. If you only knew one thing about this setup, "the options are expensive relative to what this stock usually does" would be the useful thing.
With the stock near $324, a 4% implied move frames a post-earnings range of roughly $311 to $337. The market is saying the outcome lands in there, and it is charging a lot for that opinion.
Why the 4% Might Actually Be Fair This Time
Now the discipline, because "implied moves are always overpriced" is exactly the lazy consensus this site exists to poke.
There is a concrete reason Apple's earnings risk is genuinely higher than a typical quarter: this is Tim Cook's last earnings call as chief executive. CEO transitions at the largest company in the world introduce real two-sided risk, on succession commentary, strategy signals, and tone. That is not noise the historical 1% average captures, because the past year contained no such event.
Two other live wires make the same point. Apple's call is also the market's next real read on the CXMT memory qualification question, which moves the entire DRAM complex more than it moves Apple. And the print lands two days after a Fed decision with a genuine hike debate.
So "4% is a rip-off" doesn't survive that list. "4% is expensive by history and defensible by circumstance" does, and that is a much harder trade than the vol-sellers admit.
Reading the Individual Trades
Flow data rewards you for separating conviction from confetti.
The one worth respecting: $2.6 million of August 280-strike calls. This was the biggest trade of the day, a new position, deep in the money with a delta near 1. Delta near 1 means it moves essentially dollar-for-dollar with the stock, so this is a stock replacement: the buyer gets Apple exposure for less capital than buying shares, with the loss capped at the premium. Real size, real money, and an expiry in mid-August that deliberately spans the earnings date. Of everything on the tape, this is the trade that looks like someone with a view rather than someone buying a raffle ticket. The caveat: even this could be one leg of a spread, or a hedge against a short position you can't see.
The one that misleads: the 300-strike put. It was the most popular contract by volume Friday at 7,500 contracts, but only $374,000 of premium. Do the division and each contract cost about $0.50. That's cheap tail insurance, not a bearish thesis. Note what just happened: the volume leader was a put while the premium leader was a call. Counting contracts would have told you the opposite story to counting dollars. Always weight by premium.
The $340 Call Trap
This is the detail worth stopping on, because it's where retail money goes to die.
The 340-strike call expiring Friday traded 5,000 contracts for about $2.3 million, at $4.25 a contract. It's commonly framed as needing Apple to rally 3.4% past its all-time high near $335 to work.
That framing is wrong, and expensively so. Reaching $335 gets the stock to the neighborhood of the strike. To break even at expiration you need $340 plus the $4.25 you paid, or $344.25. From roughly $324, that is not a 3.4% rally. It is roughly a 6% rally, to a decisive new all-time high, inside one week, immediately after a volatility crush.
Buying a call whose strike is above the all-time high, that expires days after the event, is a lottery ticket with a lottery ticket's odds. It can pay before expiry on a fast move, but at expiration the bar is $344.25.
What the Open Interest Says
Open interest is more informative than a single day's volume because it's accumulated positioning that survived. The heaviest strike for this Friday's expiry is $320, with 13,000 calls against 5,000 puts.
That concentration matters through dealer hedging. Market makers who are short those calls hedge by buying stock as the price rises toward the strike and selling as it falls away, which tends to pin the price near a heavily-owned strike into expiry. Big call open interest just above spot can act as a ceiling, because dealers mechanically sell into rallies to stay hedged. Break decisively through it, and the same mechanic reverses into fuel as they scramble to buy.
The bullish interpretation offered for that $320 wall is that traders expect last week's lows to hold. That's plausible. The more precise statement is that $320 is now a magnet, and magnets work in both directions.
What History Actually Suggests About Direction
Putting it together, here's the evidence-based ranking of these signals:
- Call-put ratios: weak directional signal. Crowded positioning tells you about fragility, not destination. Sometimes it's contrarian.
- Implied versus realized move: the strongest reliable edge, and it's about size, not direction. Options into mega-cap earnings tend to be priced rich, which favors sellers on average, with the emphasis on average.
- Deep in-the-money size trades: modestly informative. Big, directional, capital-committed positions carry more signal than cheap out-of-the-money volume, but you never see the whole book.
- Open interest walls: informative about behavior near expiry, via pinning and dealer hedging, not about fundamentals.
And the essential caveat, freshly earned: average is not always. Tesla's options priced a big move into its print last week and the stock still collapsed roughly 16% across two sessions as the market repriced its margins. Selling volatility works until the quarter that actually matters shows up, and then it pays for every premium you ever collected.
The Options Angle
- Do not buy short-dated out-of-the-money options into this. You're paying four times the historical move and then handing back the volatility premium the second the release hits. The 340 call is the case study.
- The structural expression of "expensive vol, boring stock" is an iron condor around the expected move. That was our call in the original Apple preview and the 4%-versus-1% gap sharpens it. Define the risk, because a CEO-transition call is exactly the sort of thing that breaks a condor.
- If you want direction, buy it the expensive-but-honest way: in the money and further out. The $2.6 million August 280-call trade is the template. Deep-ITM, longer-dated positions carry far less volatility premium to lose than weekly lottery tickets.
- If you hold Apple shares, elevated implied volatility is a gift. Writing a covered call into an inflated pre-earnings bid pays you the premium the speculators are overpaying, at the cost of capping upside if Cook's farewell lands well.
- Ask which side of the line you're on. A weekly out-of-the-money call on an earnings print is the gambling side, whatever the flow data says.
The One-Line Read
Apple's options tape is loudly bullish and that tells you almost nothing about direction, because volume can't distinguish a conviction buyer from a hedge; the signal worth trading is that the market is charging for a 4% move on a stock that typically delivers 1%, which is expensive by history and defensible only because Tim Cook's final call is real event risk, so if you must be involved, sell the inflated premium or buy depth and time, and leave the $340 weeklies to people who haven't done the breakeven math.
Next up:AAPL reports Mon, Nov 2 after the close →
More on $AAPL
$AAPL · 2026-07-30
Why Did Apple Stock Drop After Earnings? Services Missed, Then the September Guide Came In Light
$AAPL · 2026-07-29
Apple Reports Tonight: $108.9 Billion Expected, iPhone Up 23%, and Tim Cook's Last Earnings Call as CEO
$SPY · 2026-09-19
Stock Market Week Ahead (Sep 21-25): Costco, AutoZone, KB Home and a 5% Ten-Year
Updated Every Saturday
The Week Ahead
Every earnings date, Fed event and setup for the current trading week, on one page.
Refreshed Weekly
Earnings Calendar
Who reports next, when, and what consensus and the whisper expect.
The Week-Ahead Brief
Don’t miss next week’s setups. Get the Sunday brief.
Latest issue, Oct 25“The Fed, Microsoft, Alphabet and Amazon: the busiest week of earnings season”
Every Sunday: next week’s earnings dates, Fed days and the trades worth watching, from the same desk that writes the week-ahead hub. Free, built for retail investors.