TJX and Ross Earnings (Aug 19-20): The Street Is Above Both Guides
TJX beat Q2 on August 19 with comps up 4% and EPS of $1.36 against $1.18, raising the year to $5.31-5.36, past the Street's $5.22. A light Q3 guide sent it down premarket. Ross reports August 20.
UPDATE (August 19): TJX beat everywhere except the next quarter. Q2 EPS came in at $1.36, up 24%, against the $1.18 consensus, on net sales of $15.2 billion, up 5%, with comps up 4%, all described by the company as above plan. The sequential margin squeeze modelled below did not show up. The full-year guide went to $5.31-5.36 from $5.08-5.15, straight through the Street's $5.22, with the pretax margin outlook raised to 12.3-12.4% and the 3-4% comp plan held. What the market traded instead: a Q3 guide of $1.30-1.32 against a $1.35 consensus, and the stock fell about 3% premarket on it, per Reuters. Row 2 of the trade log, long into the print, gets scored on tonight's close rather than the premarket. Ross still reports Thursday after the bell, with its reaction session Friday.
UPDATE (August 19, 4:15pm ET): TJX closed at $144.50, down 4.21%. It opened at $144.14, rallied most of the way back to $150.53, then gave all of it up and set the low at $141.94 in the afternoon. The realised close-to-close move of 4.21% landed just inside the ±4.4% the options were pricing, so the market sized this reaction almost exactly right, which is the opposite of what the July calibration note in this piece warned about. Row 2, long into the print, is down 5.0% against the $152.11 it was struck at. Row 1 is closer than it looks: the pass was on a $152.50 straddle costing roughly $6.69, with a lower breakeven at $145.40, and the close at $144.50 is 90 cents through it. That row is not settled until Friday's expiry and is left open. Ross closed at $234.69, down 0.72%, before its own print tomorrow evening.
UPDATE (August 20, 2026, After the Close): Ross beat, and about a fifth of the beat is a tariff refund. Ross reported Q2 sales up 13.3% to $6.26 billion with comparable store sales up 10%, against the 6-7% guide, and GAAP EPS of $2.66 against the $1.85-1.93 guide and the $1.92 consensus. Roughly $0.60 of that EPS came from tariff refunds, the same shape as Walmart, Deere and Advance Auto Parts this week; ex-refund, EPS is still roughly $2.06, comfortably above guide, unlike AAP's print the same morning. Operating margin rose 610 basis points, 405 of them from the refund; ex-refund it rose 205 basis points against a company plan of 130-150. Full-year EPS guidance moved to $8.61-$8.77 from $7.50-$7.74, and Q3-Q4 comps are now guided to 6-7% and 4-5%. The stock traded up 7.05% to $245.15 after hours, which is not the close this piece's Row 3 is graded against; that grading stays deferred to Friday, August 21's regular-session close, per the row's own rule.
TL;DR
- TJX reports Wednesday, August 19 before the open. Ross reports Thursday, August 20 at about 4:00pm ET, so Ross's reaction session is Friday the 21st, not Thursday.
- Ross grew comparable sales 17% last quarter against a prior year that was flat. That is the number to hold onto: the base was zero. Ross then guided Q2 comps to 6-7%.
- Consensus sits above both companies' own full-year guides. Ross guided $7.50-7.74; the Street is at $7.79. TJX guided $5.08-5.15; the Street is at $5.22.
- TJX's Q2 consensus of $1.18 is a penny below the $1.19 it earned in Q1, on revenue expected about 5.6% higher. Flat earnings on higher sales means a thinner margin, which is what TJX told everyone to expect when it flagged fuel costs in May.
- Options price a 4.4% move for TJX. In six of its last eight prints the stock stayed inside the implied move. Both exceptions broke upward.
More on Earnings: Stock Market Week Ahead (Sep 21-25): Costco, AutoZone, KB Home and a 5% Ten-Year →
When Do TJX and Ross Report Earnings?
TJX reports before the US market opens on Wednesday, August 19, with CEO Ernie Herrman on the call. Ross Stores reports Thursday, August 20 at approximately 4:00pm ET, after the close.
That gap matters for anyone pricing the week. TJX trades on its numbers the same morning; Ross does not trade on its numbers until Friday, August 21, alongside the flash PMIs. The rest of the week is in the retail earnings hub and the full slate is in the earnings calendar.
The Board
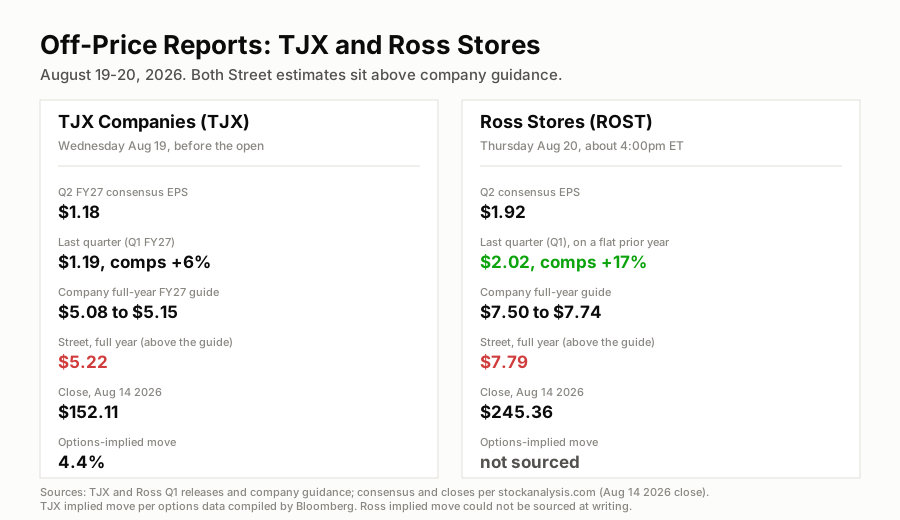
Two off-price retailers, and in both cases the sell side has already gone past what management promised.
The Trade-Down Story Is Real, And It Is Also Priced
The setup writes itself. July retail sales fell 0.6% against a consensus that wanted a small gain, and preliminary August sentiment came in at 51.0, down from 55.2. When shoppers get careful they go looking for name brands at a discount, which is the entire off-price proposition. Both of these companies just posted numbers that support it.
I believe the structural story. Middle-income shoppers moving into TJ Maxx and Ross is a genuine shift, and department stores have been losing that customer for years. What I am less sure about is whether Wednesday and Thursday are the sessions where believing it pays.
TJX trades at 29.6 times trailing earnings, Ross at 34.3 times. On each company's own full-year guide, TJX is near 29.7x and Ross near 32.2x. Ross carries roughly a two-and-a-half turn premium to a larger, more diversified competitor, and it is the one lapping the harder quarter.
Ross Lapped a Flat Quarter
$2.02. That was Ross's Q1 earnings per share, up 37% from $1.47, on comparable store sales up 17% and total sales up 21% to $6.0 billion. Operating margin came in at 13.4% against a plan of 11.8-12.1%. By any reading it was an exceptional quarter, and management raised the year on the back of it.
The prior-year comp was flat. Ross put a 17% number on top of a zero, which is a different achievement from putting 17% on top of a strong quarter, and the company's own guidance says as much: Q2 comps are guided to 6-7%, ten points below what Q1 delivered, and the full year to the same 6-7%.
So Q1 was the outlier and Ross has already said so. The question for Thursday is what the Street has done with that.
Consensus for Q2 is $1.92 against a guide of $1.85-1.93, a cent below the top. For the full year, consensus is $7.79 against a guide of $7.50-7.74, five cents above the top. Analysts are not merely taking Ross at its word; on the year they have gone past it.
There is a defensible reason. Ross beat the midpoint of its Q1 guide by 23.5% and carries a trailing four-quarter average surprise near 10.2%, so treating the guide as a floor has been the winning read for a year. My concern is narrower. The Q2 consensus of $1.92 sits only 1.6% above the Q2 guide midpoint, so the optimism went into the full-year number instead. A beat is probably coming. It has to be a large one to move a stock at 32 times a guide the Street has already passed.
TJX Has the Lower Bar, and It Said Why
TJX's setup is the friendlier of the two, mostly because expectations came down.
Q1 was strong: comps +6%, EPS $1.19 (up 29%), net sales $14.3 billion (up 9%), pretax margin 12.0%, all described by the company as well above plan. Consensus for Q2 is $1.18, or $1.19 depending on the aggregator, on revenue near $15.1 billion. Against last year's Q2 that is roughly +7% on earnings and +5% on sales.
Read it sequentially instead and it looks different. Last year TJX went from $0.92 in Q1 to $1.10 in Q2, a 20% step up. This year the Street models $1.19 to $1.18 on revenue about 5.6% higher. Flat earnings on higher sales is margin compression, and TJX named the cause in May when it built higher fuel costs into the rest of the year and called them unfavourable to both margin and EPS. Crude has gone up since, which is a headwind the company has at least already owned.
TJX's full-year guide is comps +3-4%, pretax margin 11.9-12.0% and EPS $5.08-5.15, with $2.75-3.0 billion of buyback. Q1 comps ran 6% against a 3-4% full-year plan, so the same conservatism visible at Ross is visible here.
The Options Angle
Options price a 4.4% move for TJX around the August 19 print, per options data compiled by Bloomberg. The useful part is the distribution behind it: across the last eight releases TJX exceeded its implied move only twice, and both exceptions were to the upside (+6.0% against 4.0% implied in May, +8.3% against 4.3% in August 2024). February's print moved -0.7% against a 4.0% implied.
Six of eight inside the range makes selling premium look obvious, and July on this site was a standing lesson in why "implied looks expensive" is not by itself a reason. What is different here is that this is TJX's own realised history rather than a general sense that volatility is rich. It still cuts both ways: a contained stock with an upside tail is a bad straddle and a poor short-call candidate at once.
I could not source a live option chain for either name, and the Ross implied move widely quoted around this event (5.6%, or $8.05) fails on its own arithmetic: $8.05 is 5.6% of about $144, and Ross closed at $245.36. That figure is from an earlier year, so Ross gets no volatility row.
- The TJX straddle is a pass. Paying 4.4% into a stock that has stayed inside its implied move six times out of eight is paying for a tail that shows up once every four years.
- Long TJX into the print is the call I like: a cut Q2 bar, a company that has beaten plan repeatedly, and a historical breakout pattern that has only ever gone up.
- Long Ross into the print is a pass. The company is excellent and the quarter will probably beat. Consensus above the top of the full-year guide, at 32 times that guide, lapping a 17% comp built on a flat base, is a bar I would rather watch someone else clear.
Trade log
| # | Stance | Structure | Strikes and expiry | Cost or credit | Spot at writing | Implied move | Conviction | Breakeven |
|---|---|---|---|---|---|---|---|---|
| 1 | Pass | Long straddle | $152.50 straddle, Aug 21 | ~4.4% of spot; live chain not sourced | $152.11, Aug 14 close | ±4.4% | 6/10 | Needs a move beyond $145.4 or $158.8 |
| 2 | Bullish | Long shares into the print | n/a, scored on the Aug 19 close | n/a | $152.11, Aug 14 close | ±4.4% | 6/10 | Any close above $152.11 |
| 3 | Pass | Long shares into the print (ROST) | n/a, scored on the Aug 21 close | n/a | $245.36, Aug 14 close | Not sourced | 5/10 | Scored against $245.36 |
Row 3 carries no implied move because no current figure could be sourced and the widely syndicated one is stale by the arithmetic above. It is scored on direction against the Friday, August 21 close, since Ross reports after Thursday's bell.
Marked at the August 19 close. Row 1 sits 90 cents through its lower breakeven with two sessions of time value left, so the pass is behind on the day but the row stays open until Friday. Row 2 is down 5.0% at $144.50. Row 3 has not had its event yet. All three are on the Track Record ledger.
The One-Line Read
TJX goes in with a bar the Street cut for it and a history of breaking upward when it breaks at all. Ross is the better company at the worse price, already carrying estimates its own guide does not support.
Next up:PCE inflation, Wednesday at 8:30am ET →
More on Earnings
Updated Every Saturday
The Week Ahead
Every earnings date, Fed event and setup for the current trading week, on one page.
Refreshed Weekly
Earnings Calendar
Who reports next, when, and what consensus and the whisper expect.
The Week-Ahead Brief
Don’t miss next week’s setups. Get the Sunday brief.
Latest issue, Sep 27“Micron, PCE and the jobs report that decides October”
Every Sunday: next week’s earnings dates, Fed days and the trades worth watching, from the same desk that writes the week-ahead hub. Free, built for retail investors.